
Logan Brooks
Crypto expert explaining blockchain technologies in a clear and accessible way.
What Is MACD In Crypto And How To Use It?
Table of Contents
Do you feel like the crypto market is full of unpredictable price swings, making it hard to navigate? What if there was a tool to help you spot patterns and make smarter decisions? For this, enter MACD — a powerful indicator that many successful traders rely on to find clarity in the chaos.
MACD isn’t just another analytical tool — it’s one of the few indicators that gives you real-time insight into both trend direction and market momentum at the same time.
Ready to take your trading strategy to the next level? Let’s dive into what MACD is, how it works, and how you can use it to make more informed decisions in the fast-paced world of crypto.
What Is MACD?
The Moving Average Convergence Divergence (MACD) in crypto is a simple yet powerful indicator that helps traders understand where the market is heading. It analyzes price changes to show whether a trend is gaining strength or starting to weaken. With its help, traders can spot the right moments to buy or sell and avoid common mistakes. In the fast-changing crypto market, where prices can rise and fall unpredictably, MACD becomes an essential assistant. It works well for both quick trades and long-term strategies, giving clear signals and making it easier to make informed decisions.
How Does MACD Work?
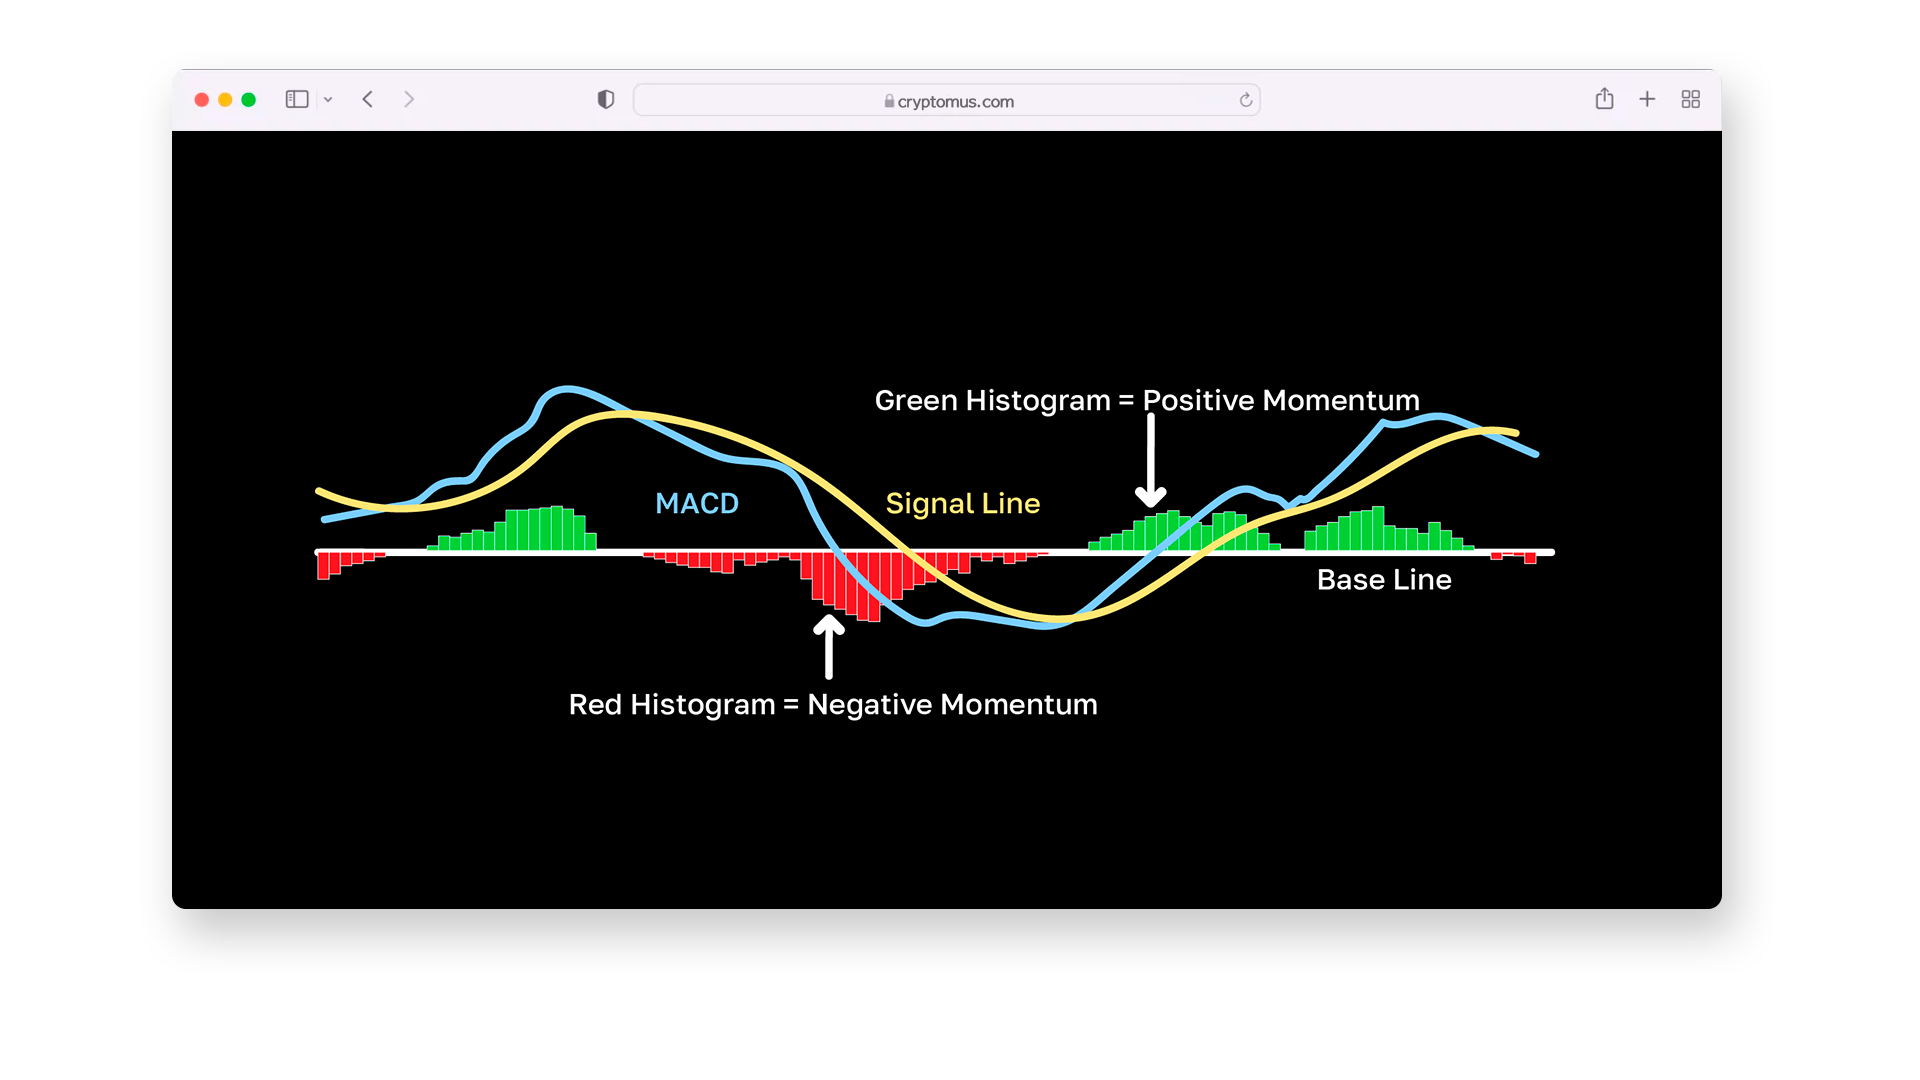
The MACD works by analyzing the connection between two exponential moving averages (EMAs); one of them reacts quickly to price changes (12-period EMA) and another moves slower (26-period EMA). The difference between these two averages creates the MACD Line, which indicates the momentum of the price. To provide clearer signals, the MACD Line is compared to a Signal Line—a 9-period EMA of the MACD Line itself.
When the MACD Line crosses above the Signal Line, it generates a buy signal, indicating upward momentum. Conversely, when it crosses below, it gives a sell signal, signaling downward momentum. The histogram, a bar chart that shows the distance between the MACD Line and the Signal Line, helps visualize the strength of these trends. Larger bars indicate stronger momentum, while shrinking bars suggest that the trend may be weakening.
Mini-schema for clarity:
- MACD Line = Fast EMA (12) – Slow EMA (26)
- Signal Line = EMA(9) of MACD
- Histogram = MACD – Signal Line
Example:
Imagine Bitcoin’s price average over 12 days is $95,500, while the 26-day is $95,000. Subtracting the 26-day EMA from the 12-day EMA gives:
$95,500 - $95,000 = $500 (the MACD Line).
Now, if the Signal Line (9-day EMA of the MACD Line) is at $480, the MACD Line is above it, signaling a potential upward trend. If the histogram shows growing bars, it confirms that momentum is building in the same direction, reinforcing the signal.
How to Use a MACD Indicator?
The MACD indicator is versatile and can be used in various ways to spot trends, confirm market conditions, and help make trading decisions. Here’s how you can use it effectively:
1. Identifying buy and sell signals. The MACD is most commonly used to identify potential buying or selling opportunities by observing crossovers between the MACD Line and the Signal Line. A buy signal occurs when the MACD Line crosses above the Signal Line, indicating increasing upward momentum and suggesting a good time to buy. Conversely, a sell signal appears when the MACD Line crosses below the Signal Line, signaling a potential downturn and a good time to sell.
2. Considering divergence. Such an aspect as divergence occurs when an asset’s price moves in the opposite direction of the MACD, potentially signaling a trend reversal. A bullish divergence happens when the price declines while the MACD begins to rise, suggesting a weakening downtrend and a possible upward reversal. In contrast, a bearish divergence occurs when the price continues to climb but the MACD forms lower peaks, indicating that the uptrend may be losing momentum and a downward reversal could follow.
3. Using the histogram for momentum. The histogram represents the difference between the MACD Line and the Signal Line, with the size of the bars indicating the strength of the trend. Increasing bars suggest strengthening momentum in the current direction, while decreasing bars indicate weakening momentum, signaling that a trend reversal may be near.
4. Overbought and oversold conditions. While MACD is not specifically designed to measure overbought or oversold levels, extreme MACD values or an overextended histogram can hint at potential exhaustion in a trend. Traders sometimes use the MACD in combination with other indicators, like the Relative Strength Index (RSI), to assess these conditions more accurately.
By combining these strategies, the MACD can help traders spot trends early, avoid false signals, and decide on the best time to enter or exit the market. However, like any indicator, it’s important to use MACD alongside other tools and not rely solely on it for making trading decisions.

Best MACD Settings for Crypto Trading
When trading cryptocurrency, choosing the right settings for the MACD indicator can make a significant difference in how accurately you identify trends and signals. While the default MACD settings (12, 26, 9) work well for many traders, you might want to adjust them to suit the unique characteristics of the crypto market. Here's how you can fine-tune the MACD settings for more effective crypto trading.
Default Settings (12, 26, 9)
These settings are suitable for general cryptocurrency trading, as they balance responsiveness and smoothness, helping to identify both short-term and medium-term trends. Here's an overview of the components:
-
12-period EMA: The faster-moving average that responds more quickly to price changes.
-
26-period EMA: The slower-moving average that smooths out the price action.
-
9-period Signal Line: A moving average of the MACD Line that helps confirm buy or sell signals.
Faster Settings (6, 13, 5)
If you’re a more active trader or focusing on shorter time frames (like 5-15 minute charts), you might prefer faster MACD settings to capture quicker price movements. The components are as follows:
-
6-period EMA: Provides quicker signals by reacting faster to price changes.
-
13-period EMA: Slightly slower to filter out noise.
-
5-period Signal Line: Makes the indicator more sensitive to price fluctuations.
Slower Settings (24, 52, 18)
On the other hand, for traders looking to follow longer trends or trade on daily and weekly charts, using slower settings can help reduce false signals and capture more reliable, long-term trends. To understand the components better:
-
24-period EMA: Provides smoother and more stable readings.
-
52-period EMA: Further smooths out price action for more gradual trend detection.
-
18-period Signal Line: Helps reduce noise and false signals.
How to Adjust MACD Settings?
In the highly volatile crypto market, tailoring MACD settings to the market's pace is essential. For more volatile conditions, faster settings (e.g., 6, 13, 5) can provide quicker responses, while slower settings (e.g., 24, 52, 18) help filter out noise and focus on broader trends.
Before finalizing your settings, it’s also important to backtest them on historical price data for the cryptocurrency you’re trading. This allows you to evaluate how well they align with the asset's behavior and your trading style.
There’s no universal MACD setting for crypto; the best choice depends on your trading time frame, the specific asset, and your risk tolerance. Experimenting with different configurations and observing their performance across various market conditions will help you fine-tune your strategy.
In conclusion, MACD is one of the most powerful and beginner-friendly indicators available in crypto trading. It blends trend analysis with momentum insight, giving traders a clearer view of what the market is actually doing — not just what the price seems to show at a glance.
But MACD isn’t a magic button — it’s a tool. Its true strength comes when you combine it with volume analysis, support and resistance levels, and solid risk management.
Understanding its features and capabilities will allow you to effectively incorporate MACD into your trading strategy and minimize risks. Thank you for reading!


Simplify Your Crypto Journey
Want to store, send, accept, stake, or trade cryptocurrencies? With Cryptomus it's all possible — sign up and manage your cryptocurrency funds with our handy tools.
Get Started