
David McMillan
Crypto-enthusiast who explores all the possibilities the blockchain technology suggests
What Are Flag Patterns And How To Use Them In Trading?
Table of Contents
There are many trading tactics in the crypto market that may provide you with a solid strategy and give you good profits later. One of these is the flag, which people use to predict price volatility on top exchanges. In this article, we will explore what flag patterns are and explain their formation and application in trading.
What Are Flag Patterns?
Let’s start with the definition: a flag pattern in crypto is a graph commonly utilized in technical analysis of assets, signifying a short-term pause in the current trend. It typically occurs in the direction of the dominant price fluctuation.
The pattern consists of two key parts: the first is the flagpole, which signifies a sharp rate movement, and the second is the flag itself, which reflects price stabilization in parallel borders. It is important to note that this consolidation phase often occurs at the highs of a downtrend within a confined price range.
The tactic of this pattern is to follow the direction opposite to the current trend. So, if the market is rising, the flag will point slightly downward; if the market is falling, it will slope upward. Thus, the strategies with the highest success rate are often tilted against the prevailing trend.
There are two main types of the flag pattern: bullish and bearish. Let's analyze them in more detail.
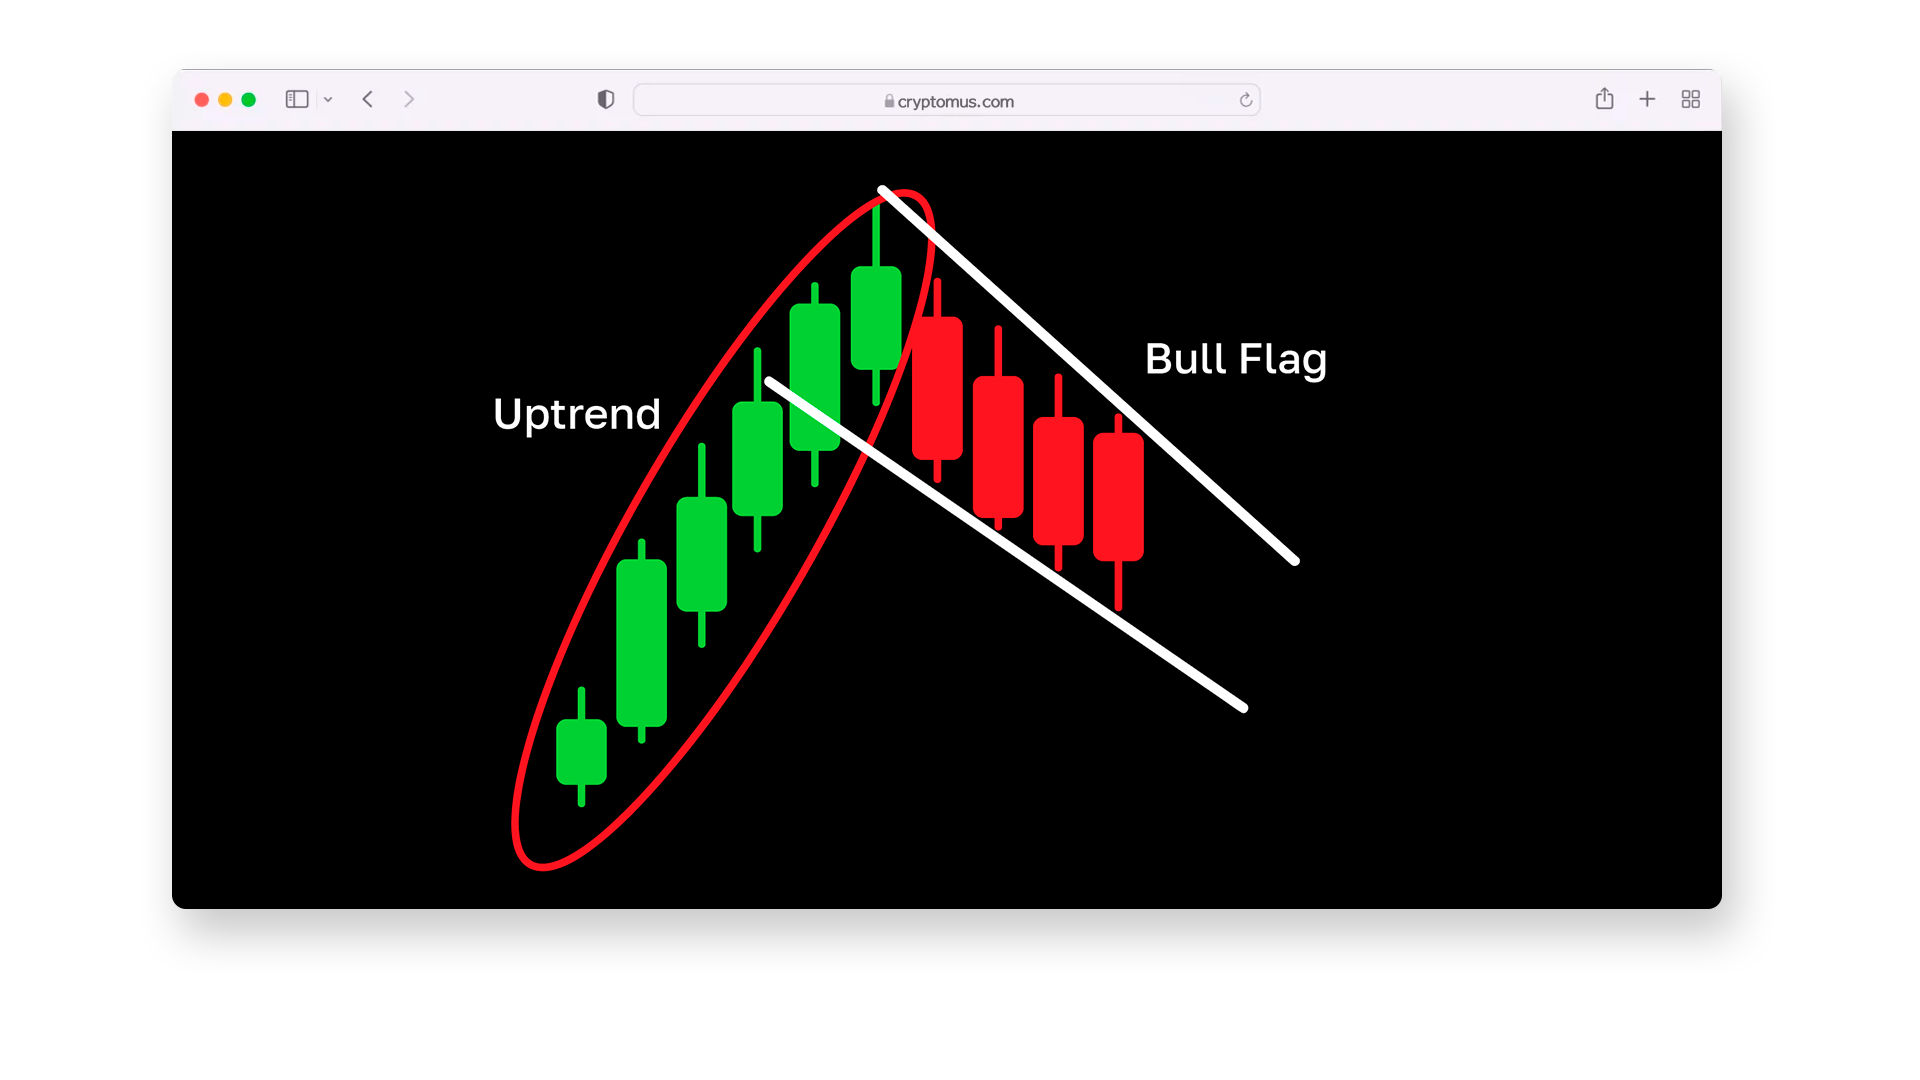
Bull Flag Pattern
A bullish flag occurs when the crypto market is moving straight up. After a significant price increase, the movement fluctuates within the flag, indicating its continuation after a short pause. Often the price subsequently breaks the upper flag line, indicating an extension of the upside trend.
How To Identify Bull Flag Pattern?
We have prepared an algorithm for you to identify a bullish flag in the market:
-
Find a strong upward movement (flagpole): the price should rise sharply in a short period of time; this marks the beginning of the pattern.
-
Look for the consolidation phase (flag): after the surge, the price starts to correct, moving within a small channel.
-
Check the volume: during the consolidation phase, the volume should decrease. It will show a weakening of the selling pressure this way.
-
Wait for the breakout: once the price breaks above the flag’s upper boundary, the strategy will be confirmed.
-
Calculate the target rate: add the height of the flagpole to the breakout point to estimate the possible profit. For example, if the flagpole measures $50 and the breakout occurs at the $200 level, the target price will be $250.
This algorithm can help you quickly and effectively recognize a bullish flag on a chart. Keep your eyes open at all times so that you do not miss the opportunity.
How To Use Bull Flag Pattern?
To correctly apply the pattern in trading, follow the algorithm and pay attention to details:
-
Open a buy position. Choose a moment when the price comes out of a consolidation period and re-enters an uptrend.
-
Calculate your target profit. To do it, you can measure the length of the flag or use the difference in price between the parallel trend lines at the edges of the pattern.
-
Set a stop loss. Do it at or just below the lower trend line.
Bear Flag Pattern
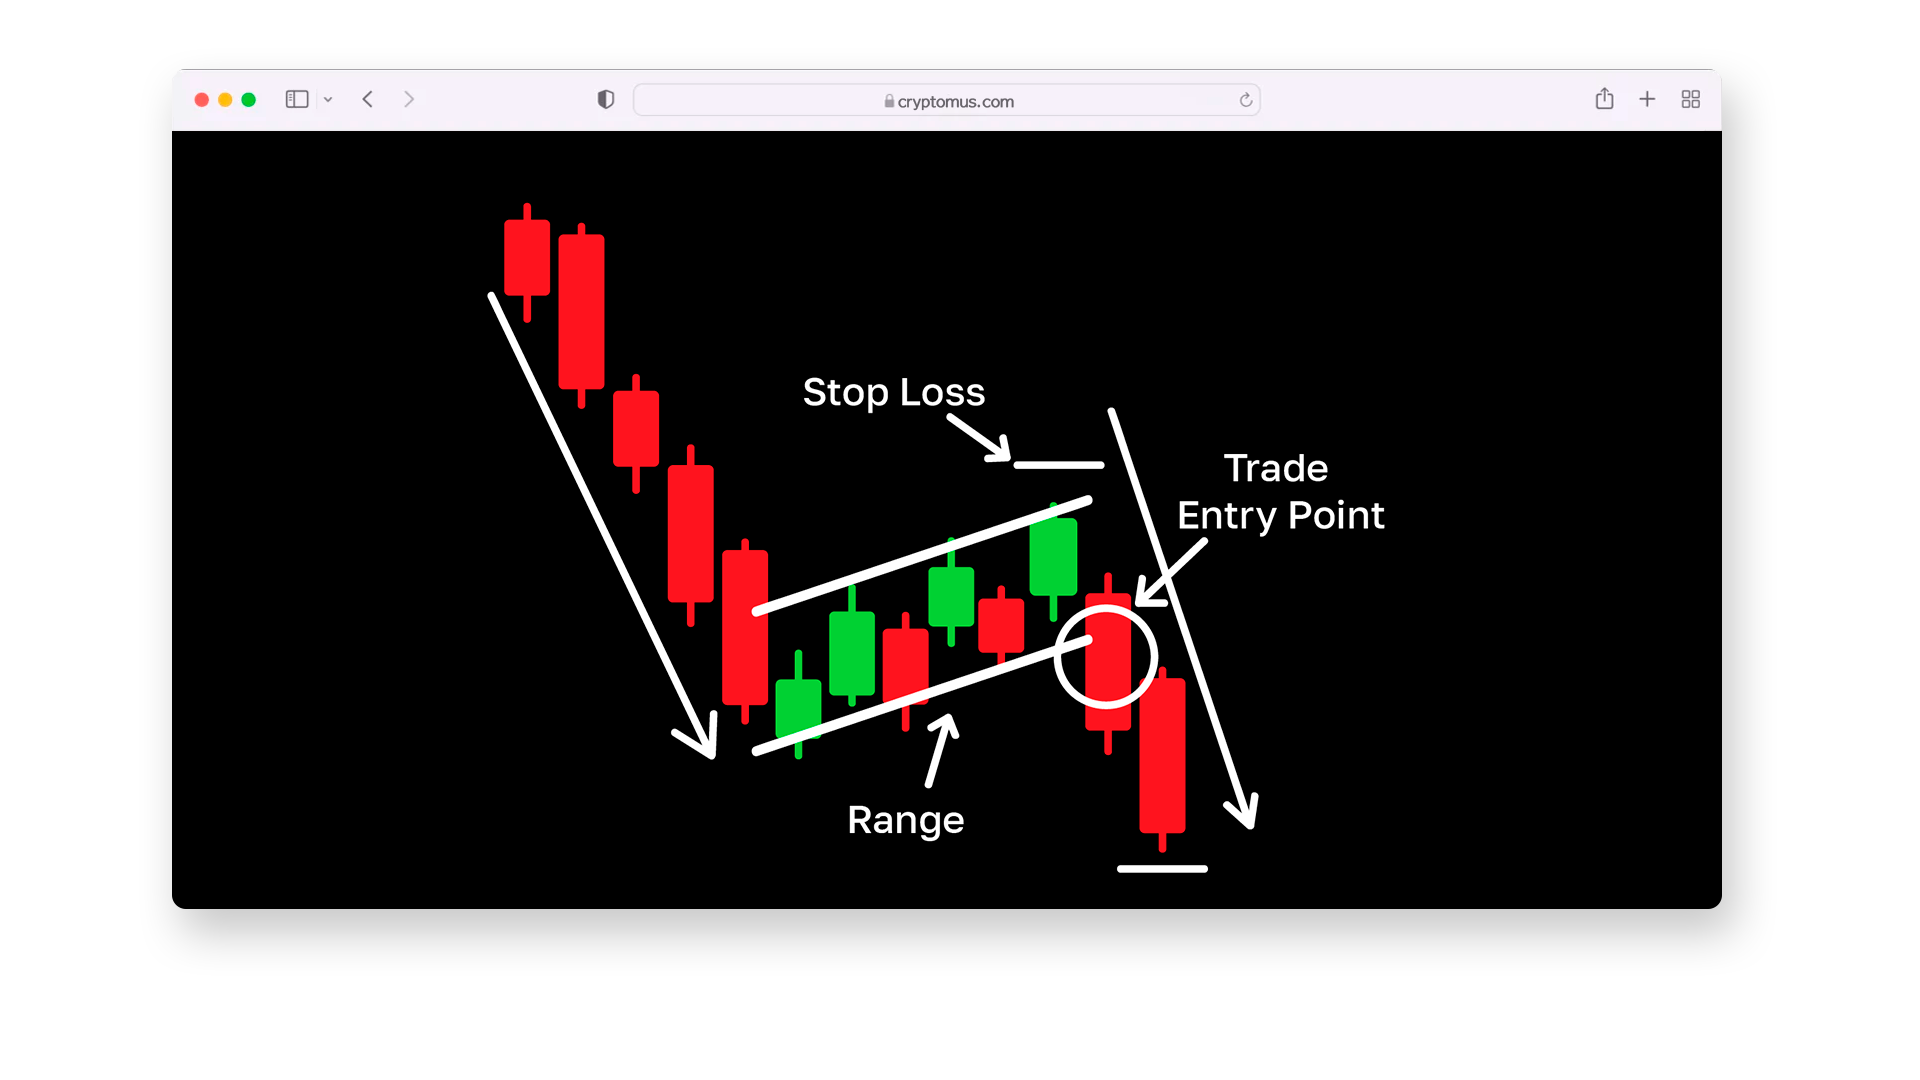
A bear flag forms during a downtrend when the crypto market is moving lower. It heralds further price declines followed by a brief consolidation phase. If the price falls below the flag line, the downtrend will continue.
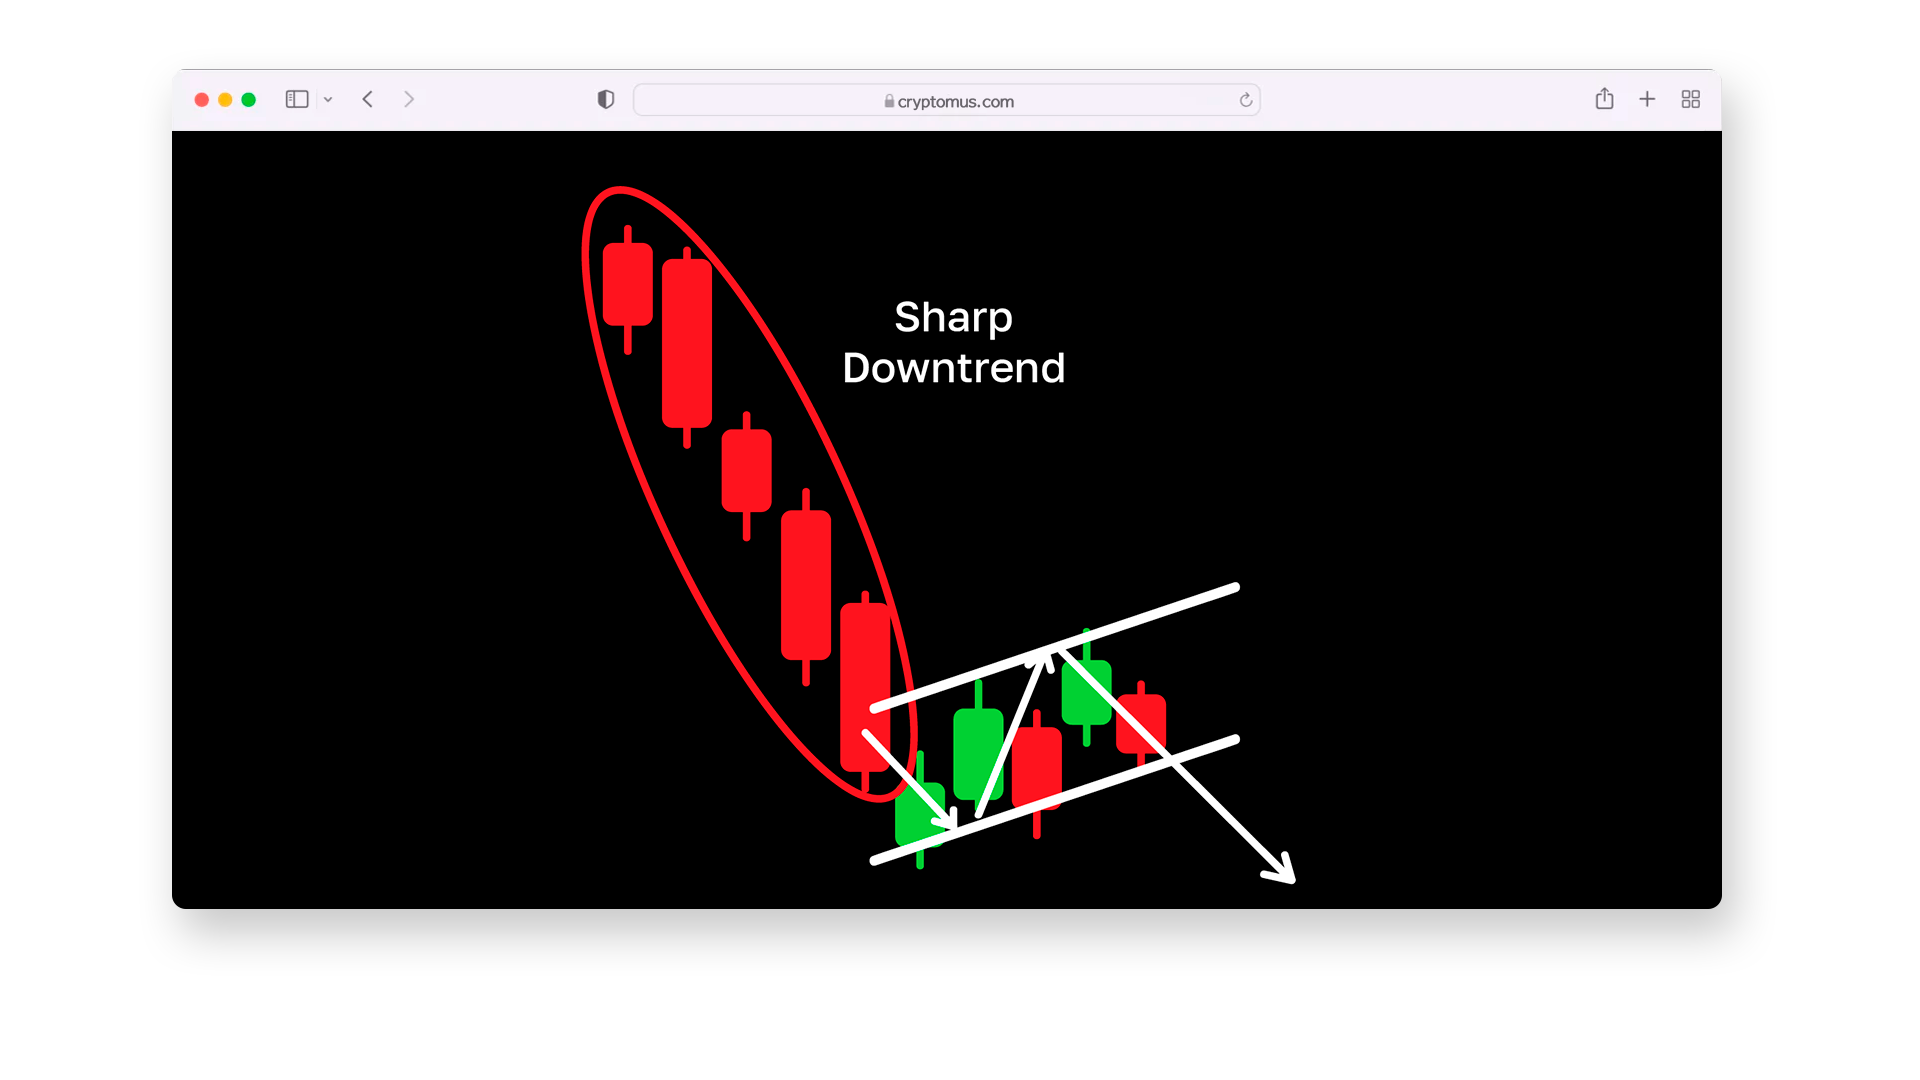
How To Identify Bear Flag Pattern?
To recognize the pattern in time, follow this step-by-step algorithm:
-
Spot a sharp downward movement (flagpole): look for a significant price drop before the flag forms. This marks the beginning of the pattern.
-
Look for a consolidation phase (flag): after the decline, the price temporarily moves against the primary trend. This usually occurs in an ascending channel.
-
Check the volume: it usually decreases during the consolidation phase and shows the weakness of buyers.
-
Wait for the breakout: as soon as the price breaks the lower boundary of the channel, this will confirm the pattern.
-
Calculate the target price: subtract the height of the flagpole from the breakout point to estimate the target price. Unlike the bullish flag, this works in reverse; if the price falls from 100 to 70 dollars, the flagpole will be 30 dollars. Then it will correct to 80 dollars in the ascending channel, and later, after the downside breakout, the target price will be 50 dollars.
This structure will help you quickly recognize a bearish flag on the chart and use it to open positions within the downtrend.
How To Use Bear Flag Pattern?
We have also prepared an algorithm for bearish trend trading using a flag pattern. Follow the described actions to successfully complete the trade:
-
Aim to open a short position. Do this only as soon as the price exits the consolidation phase and re-enters the downtrend.
-
Calculate your target profit. Choose a distance equal to the height of the initial flagpole or the price difference between support and resistance levels.
-
Set a stop loss. Find this option near the upper trend line of the flag to limit potential losses.

Bull Flag Vs Bear Flag
If both patterns are so effective, it begs the question of which one is better. So, the choice between bullish and bearish flags depends on market conditions and your trading preferences. For instance, the bullish flag works best in a growing market where assets are trending upward. This pattern is ideal for buying cryptocurrency and utilizing the trend's growth for safer entries.
On the other hand, a bearish flag is more effective in a declining market, where the overall movement is downward. It helps to open short positions and use more aggressive strategies such as entering on a pullback to the breakdown line or trading on a breakdown of the flag support level.
You should also consider your trading strategy. If you are a long trader (focused on upward movements), a bullish flag is more suitable as it provides opportunities to buy before the next rally. If you prefer shorting (making money on a decline), a bearish flag is the better choice as it signals continued downward momentum. However, to realize their full potential, use patterns with other technical analysis tools such as RSI.
Thus, we can conclude that bullish and bearish flags are powerful patterns that will give you an understanding of the trend direction. With their help, you can reduce the risks of missed profits. And you can always check the effectiveness of the strategies on the Cryptomus exchange; thanks to a large selection of trading pairs, you can experiment and combine patterns in various ways.
Have you ever used flag patterns? Write about it in the comments!


Simplify Your Crypto Journey
Want to store, send, accept, stake, or trade cryptocurrencies? With Cryptomus it's all possible — sign up and manage your cryptocurrency funds with our handy tools.
Get Started