
Martina Aguilar
Experto en крипtomonedas que explica las tecnologías blockchain de forma clara y accesible.
Qué es el indicador RSI en criptomonedas y cómo se usa
Tabla de contenido
Una de las herramientas más populares en el análisis técnico es el RSI (Índice de Fuerza Relativa). Este poderoso indicador te ayuda a detectar si un activo está sobrecomprado o infravalorado.
En este artículo, cubriremos:
- Qué es el RSI y cómo funciona.
- Cómo interpretar los niveles clave de 30 y 70.
- Consejos prácticos para usar el indicador de manera efectiva.
Si buscas tomar decisiones más inteligentes en el mercado de criptomonedas, ¡esta guía será tu recurso de referencia!

¿Qué es un RSI?
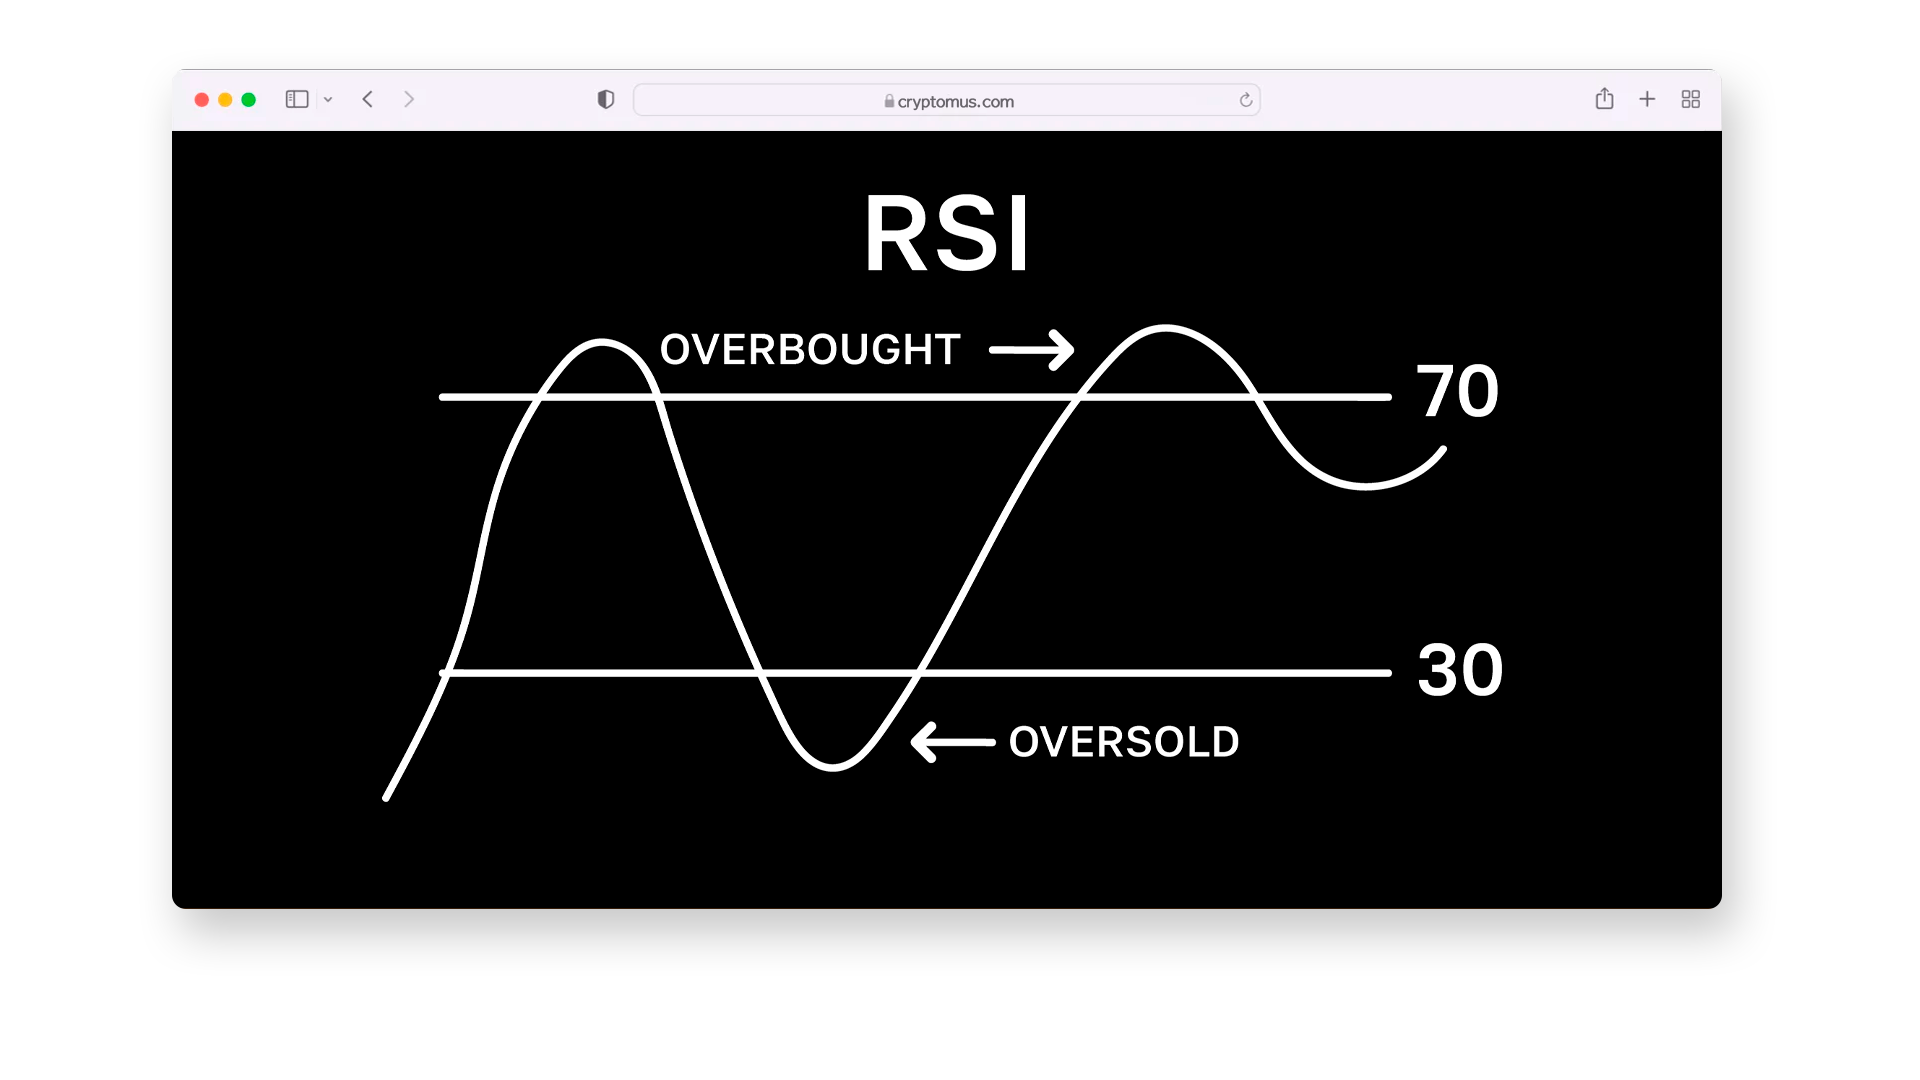
El RSI, o índice de fuerza relativa, es un indicador que ayuda a los traders a evaluar la condición del mercado. Muestra si un activo está sobrecomprado (precio demasiado alto) o sobrevendido (precio demasiado bajo). El rango del RSI va de 0 a 100; los valores superiores a 70 pueden indicar condiciones de sobrecompra, mientras que los inferiores a 30 sugieren sobreventa.
Si está operando con criptomonedas, el RSI se convierte en una herramienta importante para identificar puntos de entrada y salida. En el volátil mercado de criptomonedas, donde los precios pueden oscilar drásticamente, el RSI lo ayuda a comprender cuándo un activo está sobrevalorado o, por el contrario, cuándo su precio es excesivamente bajo. Esto puede indicar una oportunidad de compra durante una caída o una oportunidad de venta durante un pico.
¿Cómo funciona el RSI?
Ahora, analicemos cómo funciona el RSI. Se calcula en función de la relación entre las ganancias promedio y las pérdidas promedio durante un período elegido, generalmente 14 días. La fórmula es la siguiente:
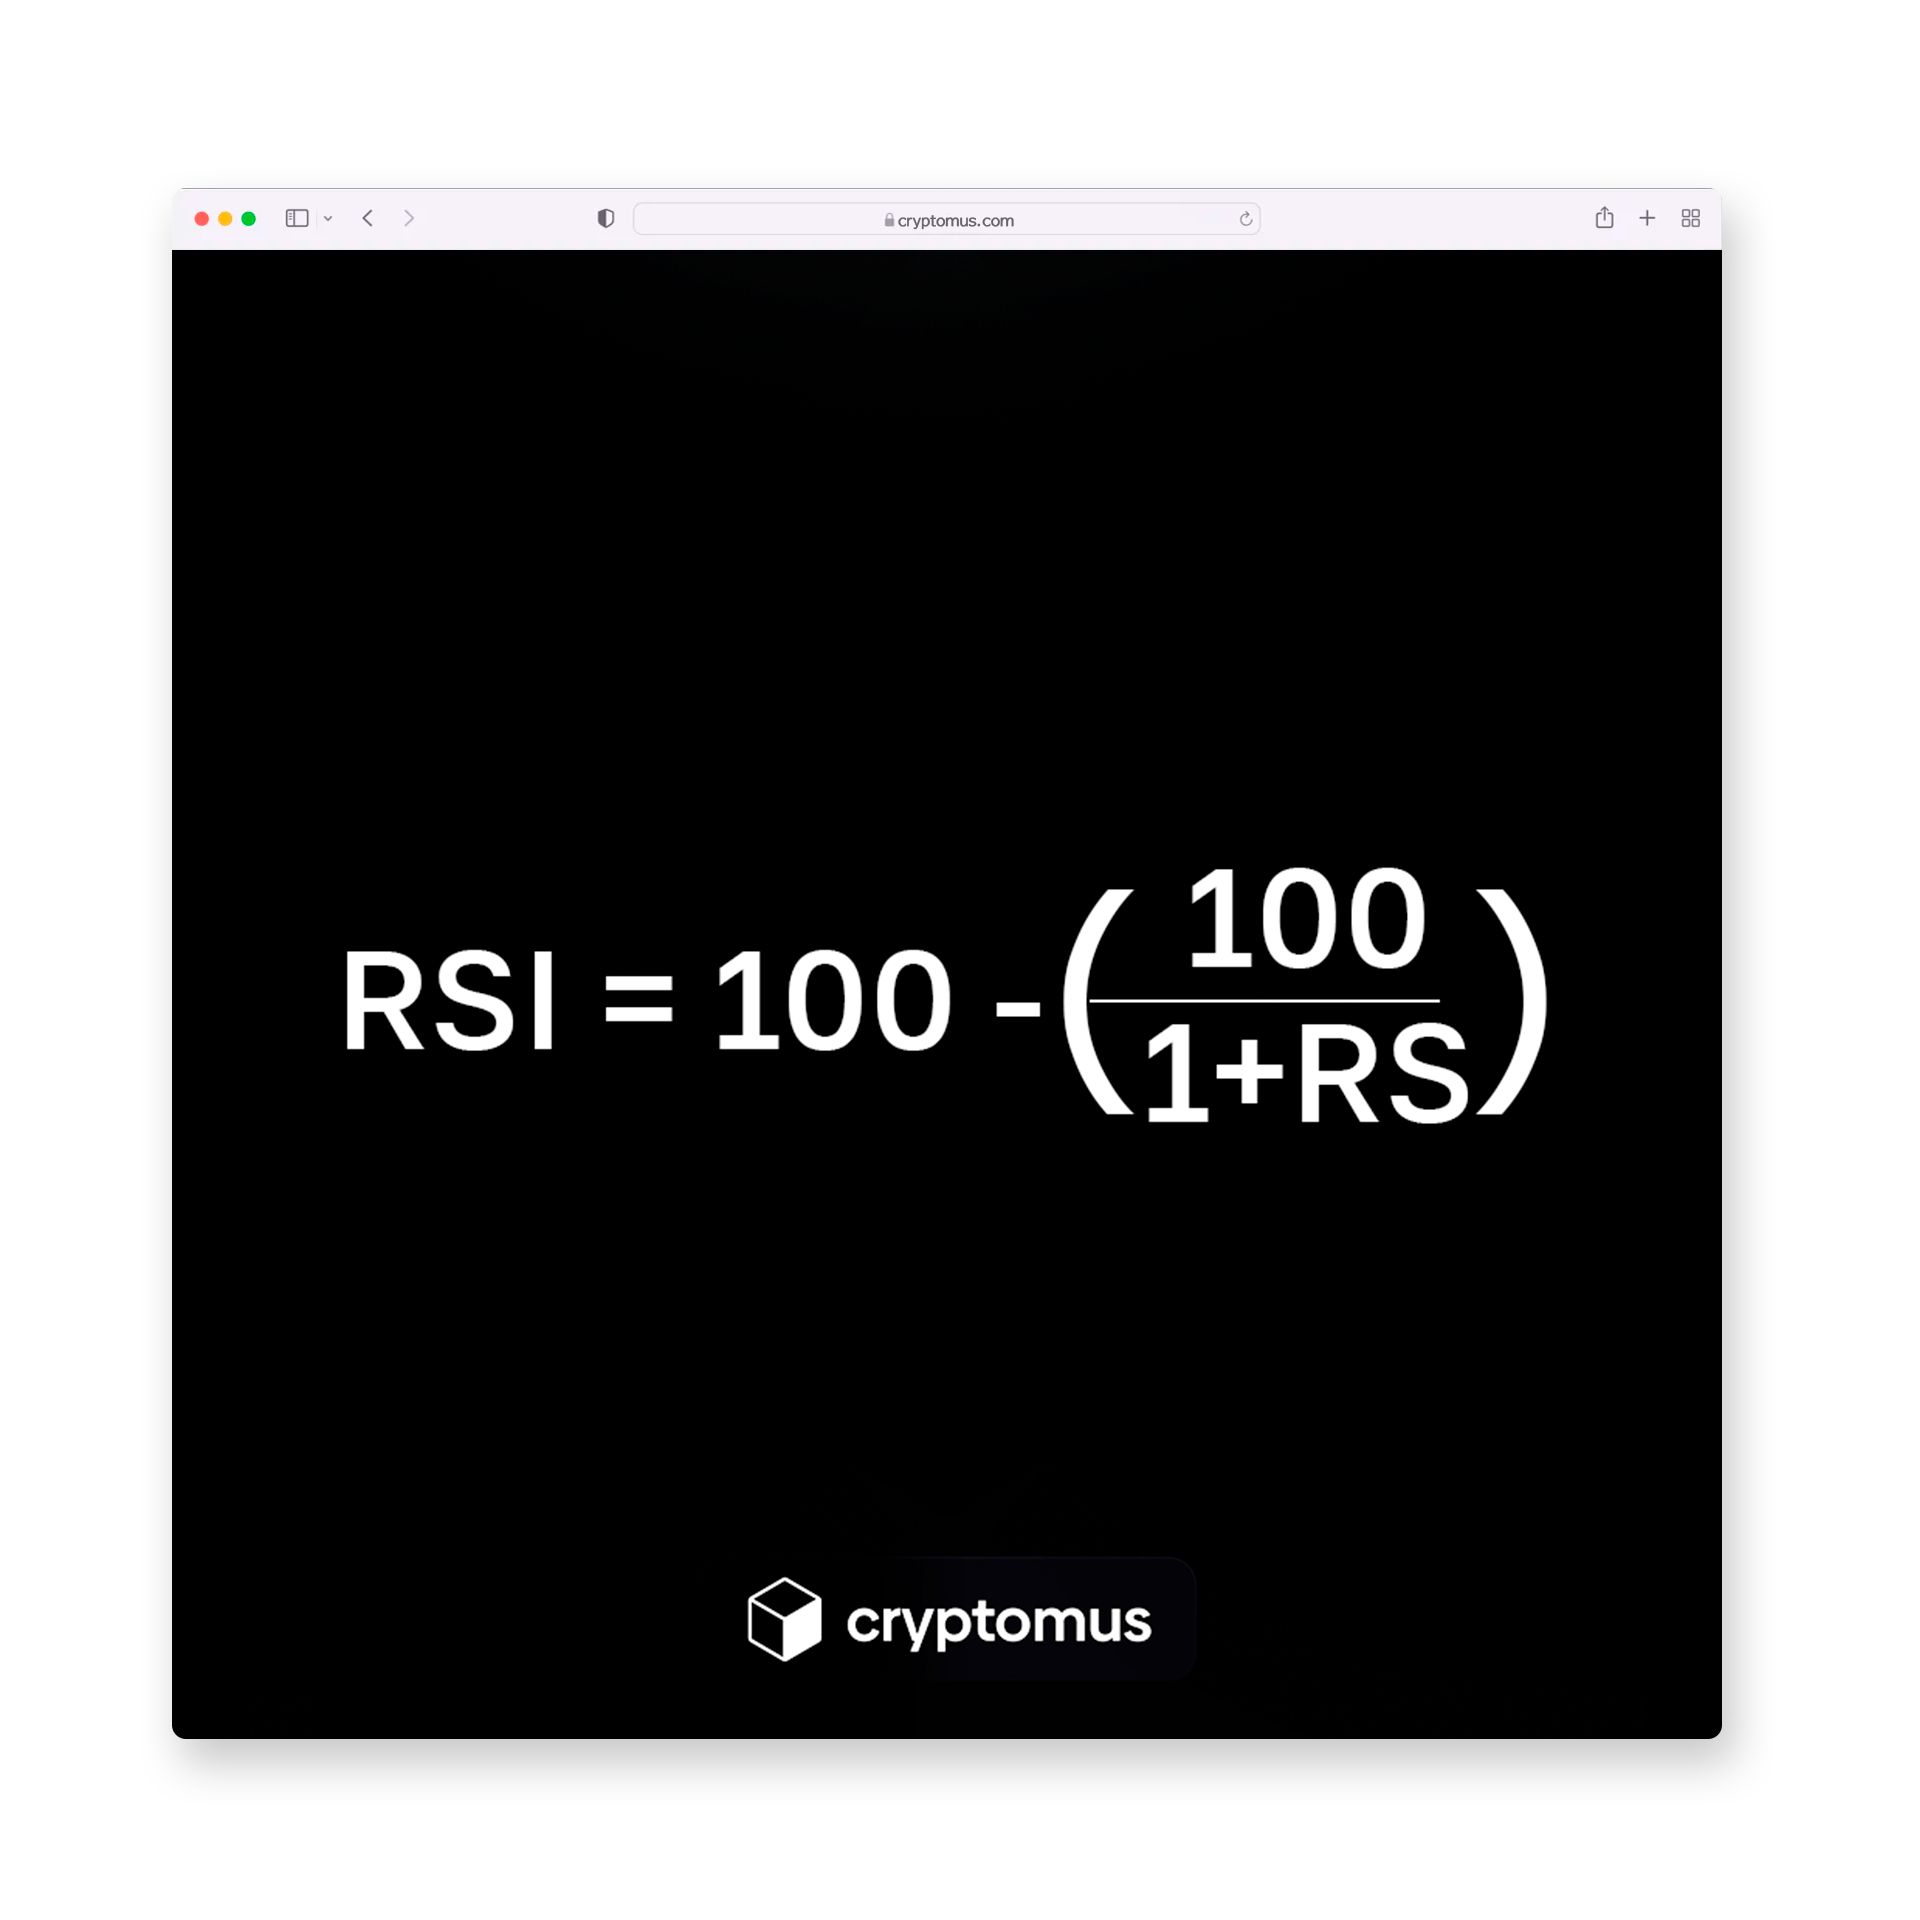
RS (fuerza relativa) es la relación entre la ganancia promedio y la pérdida promedio. Si las ganancias durante el período superan las pérdidas, el RSI será alto. Si predominan las pérdidas, el RSI será bajo.
Por ejemplo, digamos que durante los últimos 14 días:
-
En 8 días, el precio de la criptomoneda aumentó, lo que resultó en una ganancia total de $16.
-
En los otros 6 días, el precio disminuyó, lo que resultó en una pérdida total de $20.
Primero, calculamos la ganancia y la pérdida promedio:
-
Ganancia promedio: 16/14 ≈ 1,14
-
Pérdida promedio: 12/14 ≈ 0,86
A continuación, calculamos RS: 1,14 / 0,86 ≈1,33. Ahora, aplicamos el valor RS a la fórmula RSI: RSI=100−(100/(1+1,33)) ≈ 57
El RSI es 57, lo que indica que la criptomoneda se encuentra en una zona neutral, ni sobrecomprada ni sobrevendida. Esta podría ser una buena oportunidad para monitorear el mercado y tomar una decisión.
¿Cómo leer el indicador RSI?
Para interpretar correctamente el RSI, es importante comprender los niveles clave:
-
Si el RSI está por encima de 70, la criptomoneda puede estar sobrecomprada, lo que sugiere una posible caída del precio. Esto suele considerarse una señal de venta, especialmente durante fuertes repuntes.
-
Si el RSI está por debajo de 30, el activo puede estar sobrevendido, lo que significa que su precio podría estar a punto de rebotar. Esta sería una señal de compra en previsión de un aumento de precio.
Sin embargo, en el mercado de criptomonedas, donde las fluctuaciones rápidas son comunes, el RSI puede permanecer por encima de setenta o por debajo de treinta durante períodos prolongados durante tendencias fuertes. Por lo tanto, es esencial utilizar el RSI junto con otros indicadores y análisis para tomar decisiones más informadas y minimizar los riesgos.
¿Cómo utilizar el RSI en el trading?
El RSI puede ser una herramienta poderosa en su estrategia de trading cuando se utiliza para identificar condiciones de sobrecompra o sobreventa. Cuando el RSI cruza por encima de 70, sugiere que el activo puede estar sobrecomprado, lo que significa que su precio podría revertirse o disminuir. En este caso, podría ser una buena idea considerar vender o esperar un retroceso de precio. Por otro lado, si el RSI cae por debajo de 30, el activo puede estar sobrevendido, lo que indica que su precio podría volver a subir. Esta sería una señal potencial para comprar o ingresar al mercado.
Sin embargo, confiar únicamente en el RSI puede ser riesgoso, especialmente en mercados volátiles como el de las criptomonedas. Es esencial combinar el RSI con otros indicadores o análisis de la acción del precio para la confirmación. Por ejemplo, podría usar el RSI junto con los niveles de soporte y resistencia o los promedios móviles para fortalecer su proceso de toma de decisiones. De esta manera, puede aumentar las posibilidades de identificar condiciones de mercado favorables para operaciones rentables. En conclusión, si comprende cómo calcular e interpretar el RSI, podrá navegar por las fluctuaciones del mercado con mayor confianza y mejorar su estrategia comercial.
¡Gracias por leer! Esperamos que esta guía le haya resultado útil y le haya permitido comprender mejor cómo usar el RSI de manera eficaz en su aventura con las criptomonedas.


Simplifique su criptoviaje
¿Quiere almacenar, enviar, aceptar, apostar o intercambiar criptomonedas? Con Cryptomus todo es posible: regístrese y administre sus fondos de criptomonedas con nuestras prácticas herramientas.
Empezar