Julian Thorne
Crypto analyst and guide author. Making complex technologies clear for everyone.
Crypto Chart Patterns For Beginners
Table of Contents
Despite the growing popularity of cryptocurrencies, their volatility remains a mystery. What if we told you that dynamic price movements are a great opportunity for big profits? You just need to understand the patterns.
These formations serve as indicators of market behavior, helping traders decide when to enter or exit trades. In this article, we’ll look at some of the most popular chart patterns that you can start using even if you’re just beginning your crypto trading journey.
What Is a Pattern in Crypto Trading?
Cryptocurrency chart patterns are formations and structures that traders use to evaluate and predict price movements. A pattern forms when an asset's price follows a recognizable structure on the chart. Recognizing these patterns allows traders to better anticipate potential price movements.
These formations reflect the collective psychology of the market—fear, greed, and speculation—and tend to repeat across different markets and timeframes. Since human behavior is cyclical, chart structures help identify patterns in market sentiment. Studying these patterns provides investors with a structured method for analyzing cryptocurrency volatility.

Why Chart Patterns Matter?
Chart patterns help traders make more informed decisions by highlighting potential entry and exit points. They signal reversals or trend continuations, helping to significantly reduce the emotional component of trading. It's important to remember that such structures do not guarantee results and can lead to false positives. Patterns work most effectively when combined with volume analysis, trend lines, and sound risk management, especially in volatile or news-driven markets.
Types of Crypto Patterns
There are different types of patterns on cryptocurrency charts. Each has unique characteristics, such as shapes, sizes, and structures. At the same time, they have one thing in common — they are powerful tools for smart asset management and increasing the chances of profitable trading. Let's take a look at the best chart patterns like “Head And Shoulders”, “Inverse Head And Shoulders”, “Channel Up And Down”, “Falling Wedge”, and “Double Bottom”.

Head and Shoulders
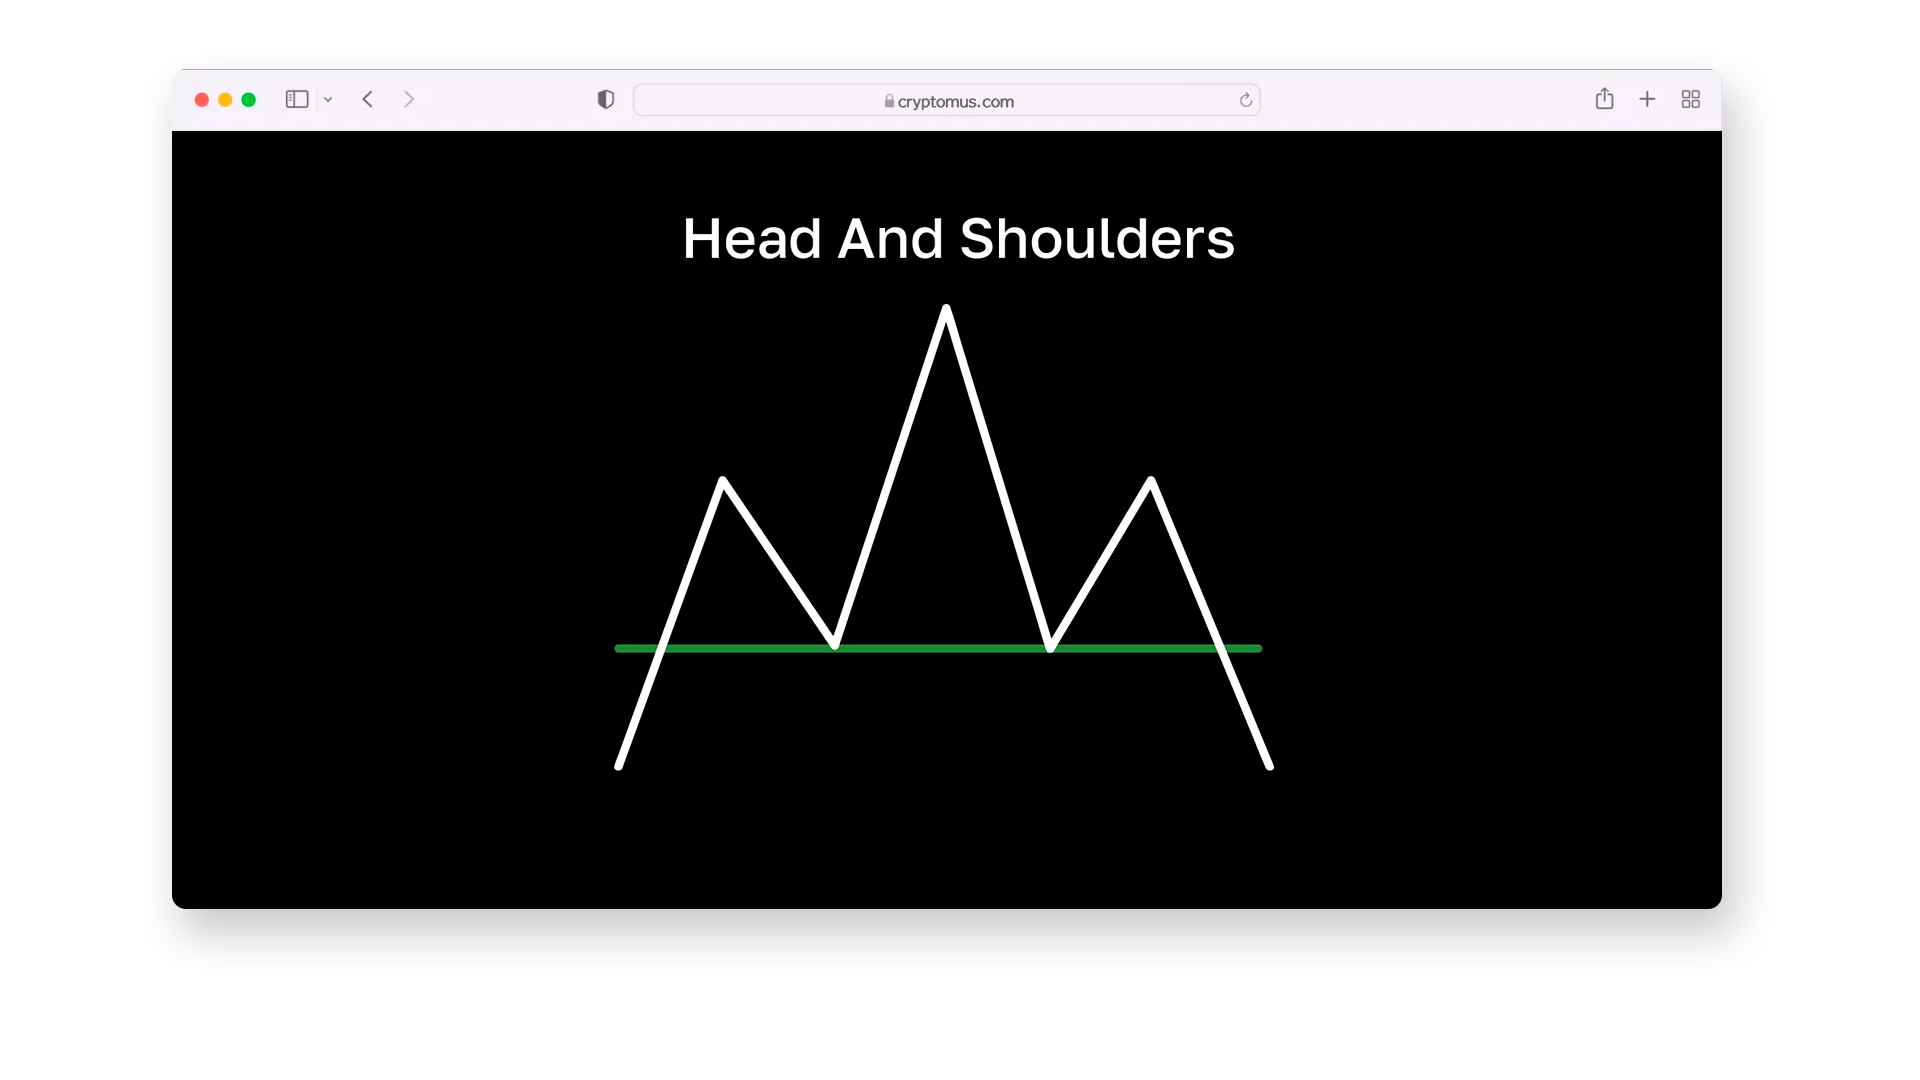
One of the most famous and powerful patterns in crypto trading is “Head And Shoulders”. It consists of three highs, where the middle one is the greatest and the two outer ones are lower and roughly at the same level. Another important element is the neckline, which connects the highs between the tops and serves as a key support level.
This pattern forms after an uptrend and often signals the upcoming market transition to a downtrend. Traders use it when the asset is ready to start a new trend. For instance, during a bearish market, the left shoulder and head form higher peaks, thus emphasizing the existing uptrend. Whereas the lower level of the right shoulder stops the move into a bullish trend.
You can place a stop loss above the breakout high or the right shoulder while trading; this will help to reduce losses in case of a false signal. To do this, measure the distance between the neckline and the head. This approach allows you to manage risk effectively and protect your capital while trading.
Inverse Head and Shoulders
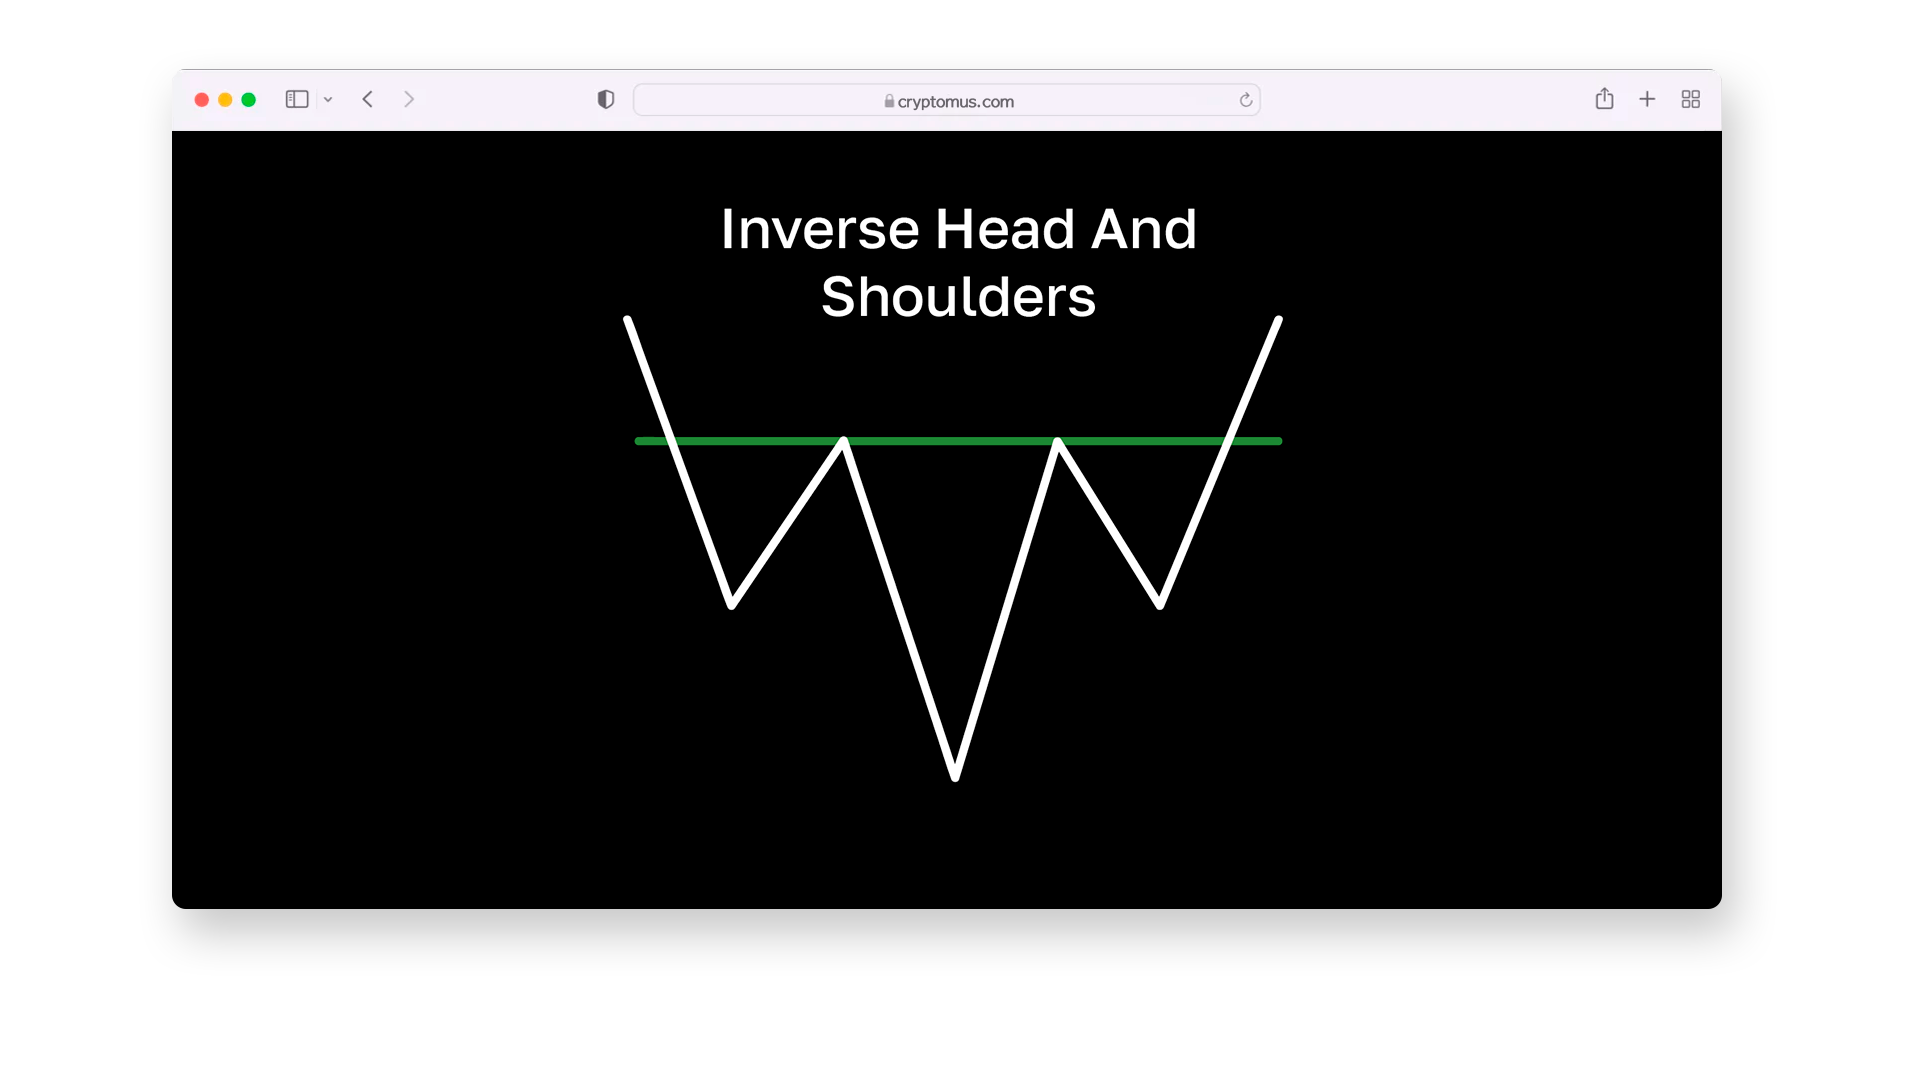
The “Inverse Head and Shoulders” pattern is the reverse of the “Head and Shoulders”, and it’s just as powerful. It consists of three lows, where the middle one (head) is on the minimum line point, and the outer ones (shoulders) are slightly higher and at about the same level. The key element is the neckline, which connects the lows of the shoulders and head. This pattern forms after a downtrend and signals an upcoming shift to an uptrend.
In the “bullish case”, the left shoulder and head form lower minimums, which indicates a bearish sentiment; the right shoulder ends above the head and stops the downtrend. If the price breaks above the neckline, it confirms a trend reversal to bullish.
To trade, first wait for the pattern to form and the price breakout; at this time volume should increase. You can place a stop loss below the minimum of the breakout candle or the right shoulder. To calculate the target, use the distance from the head to the neckline and project it upward from the breakout point.
Channel Up and Down
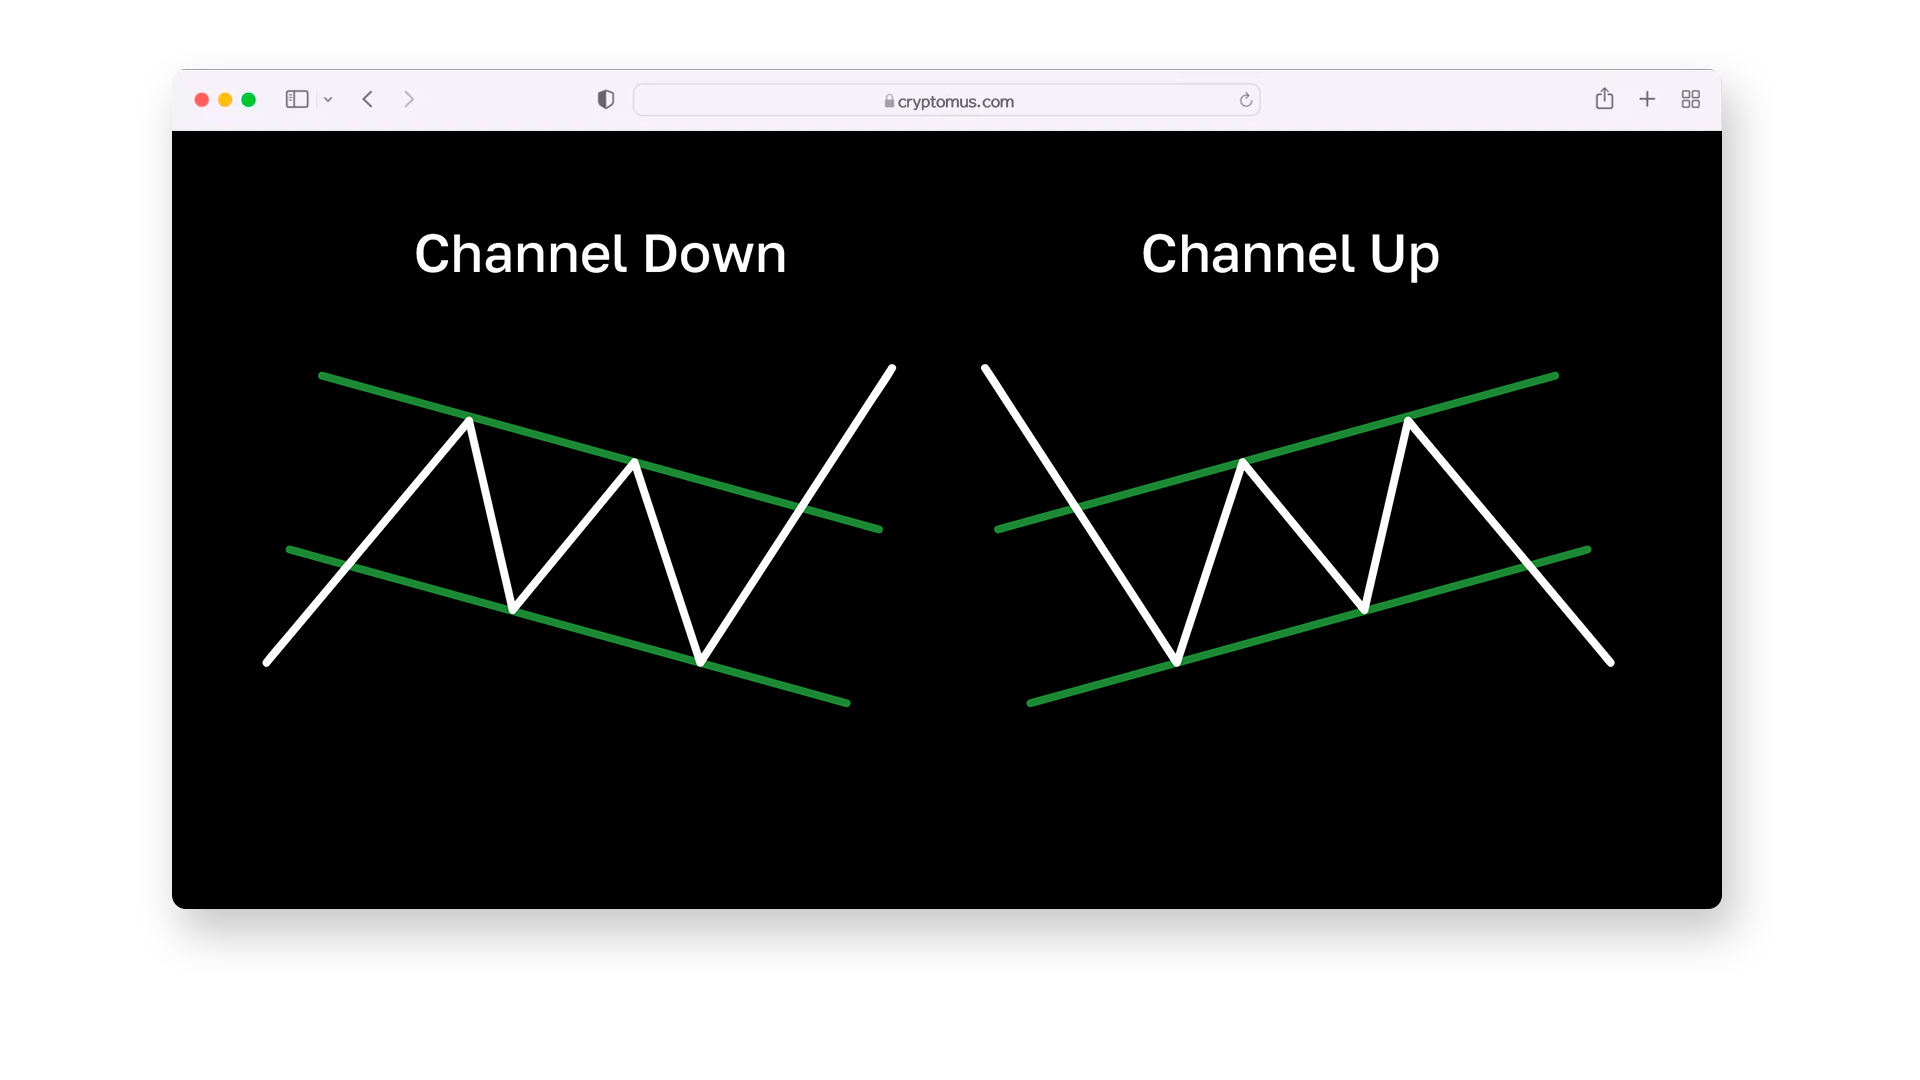
“Channel Up And Down” is a technical analysis chart pattern that shows a trading range between two diagonal parallel lines. The upper line of the channel plays the role of resistance, while the lower one serves as support, limiting price fluctuations.
“Channel Up” forms when the price moves in an uptrend and creates greater highs and lows. On the other hand, “Channel Down” appears in a downtrend when the price forms lower values. These patterns help traders identify entry points, exits, and risk levels.
When these patterns form, some traders expect prices to stay inside the channel. They may open trades when the value fluctuates between the trend lines. If the pattern ends, trades are opened when the price goes outside the channel boundaries. This happens through the upper or lower line. As for stop losses, they are placed outside the channel; it occurs below the support line in the ascending channel and above the resistance line in the descending channel. In such cases, the price often moves rapidly in the direction of the breakdown.
Falling Wedge
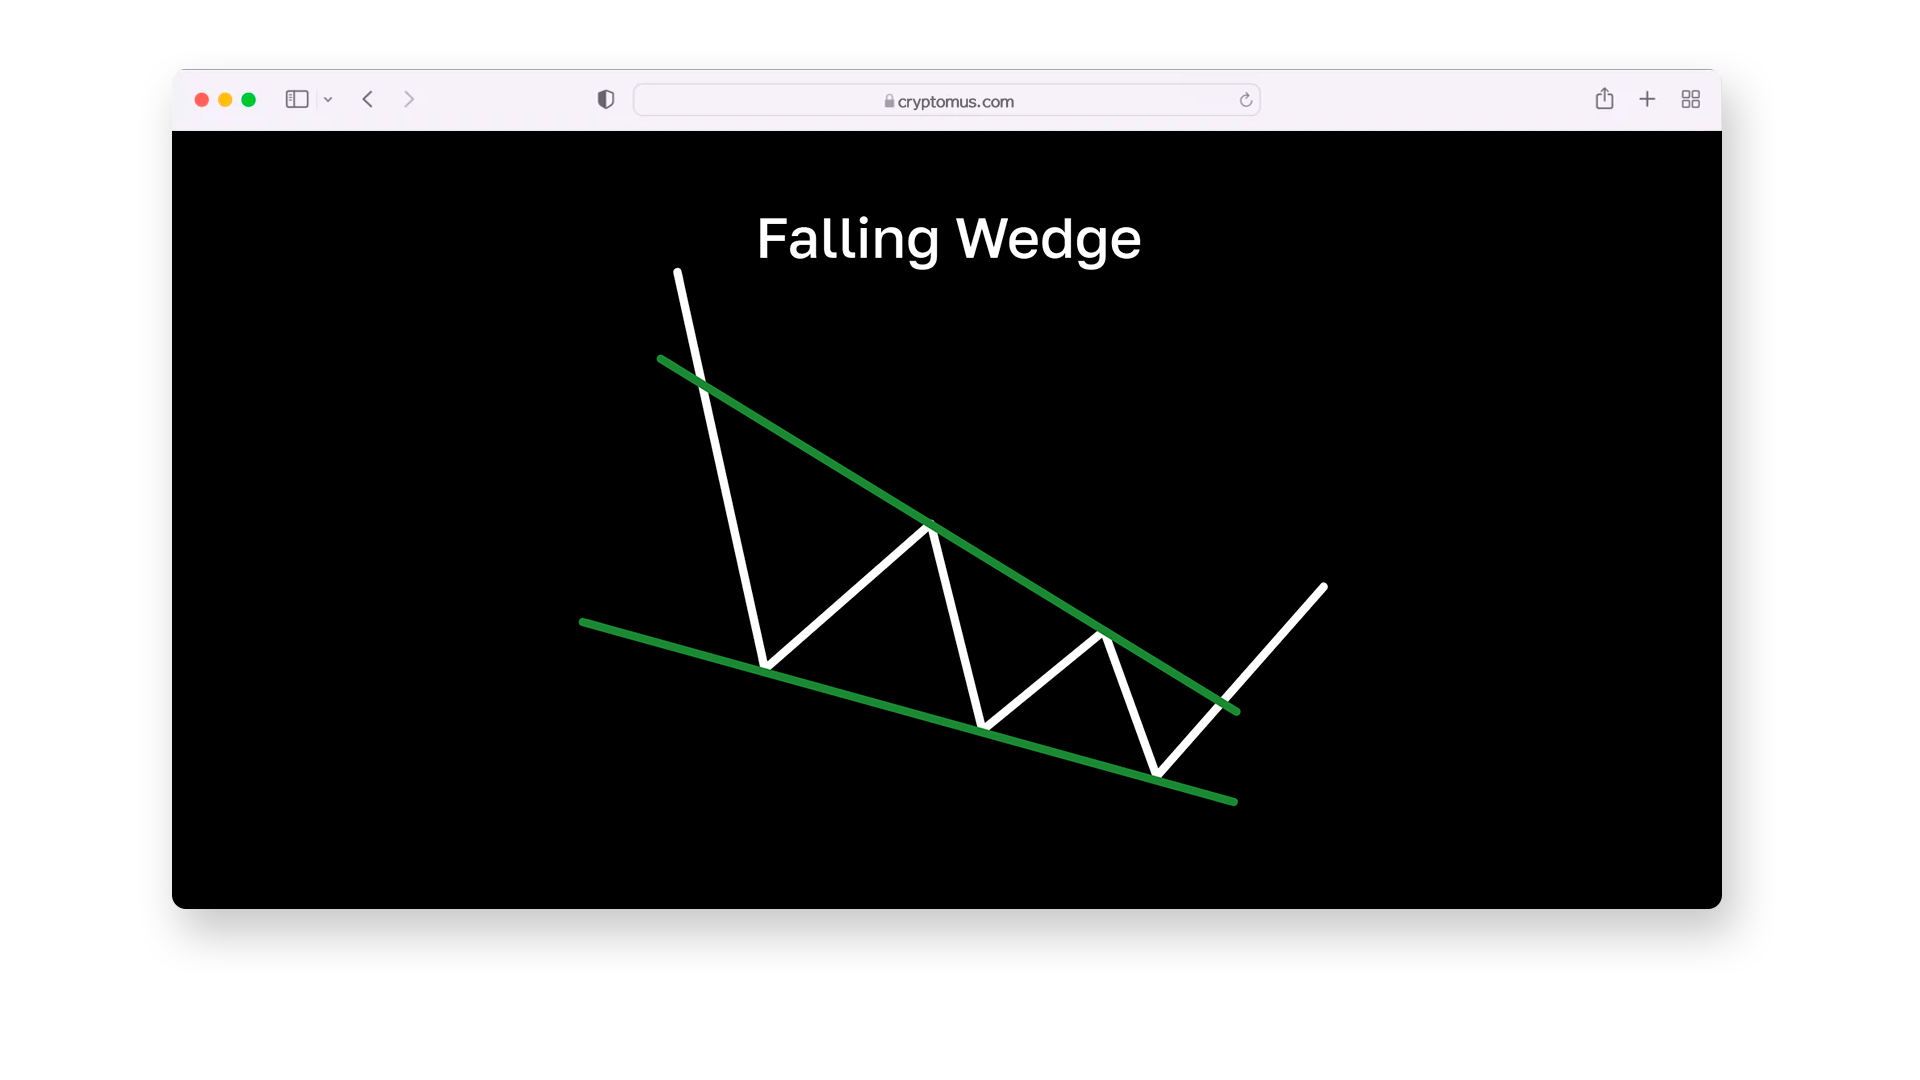
The “Falling Wedge” pattern is a bullish reversal pattern on a chart. It looks like a narrowing triangle where the trend lines connecting the local lows and highs converge downward to form a wedge shape.
This pattern signals the beginning of an uptrend after the price breaks through the upper resistance line. It occurs when there are greater highs and lower minimums on the chart. You can recognize this type of pattern when identifying horizontal support; another possibility is to define it when it occurs in the middle of an uptrend.
When the price breaks through the upper trendline, a rise is expected. Traders can trade emerging patterns (pre-breakout) between convergence lines; however, most traders should wait for the pattern to complete with a breakout before placing a buy order.
Double Bottom
The “Double Bottom” pattern indicates a potential trend reversal from a downtrend to an uptrend. It consists of two local low points located at approximately the same price level, with a short-term bounce between them. The local peak between them forms a resistance line, also called the neckline.
In the “Double Bottom”, the first low marks the extreme low of the current downtrend. This pattern often appears at the end of long-term downtrends and signals that the selling pressure has eased and buyers may begin to control.
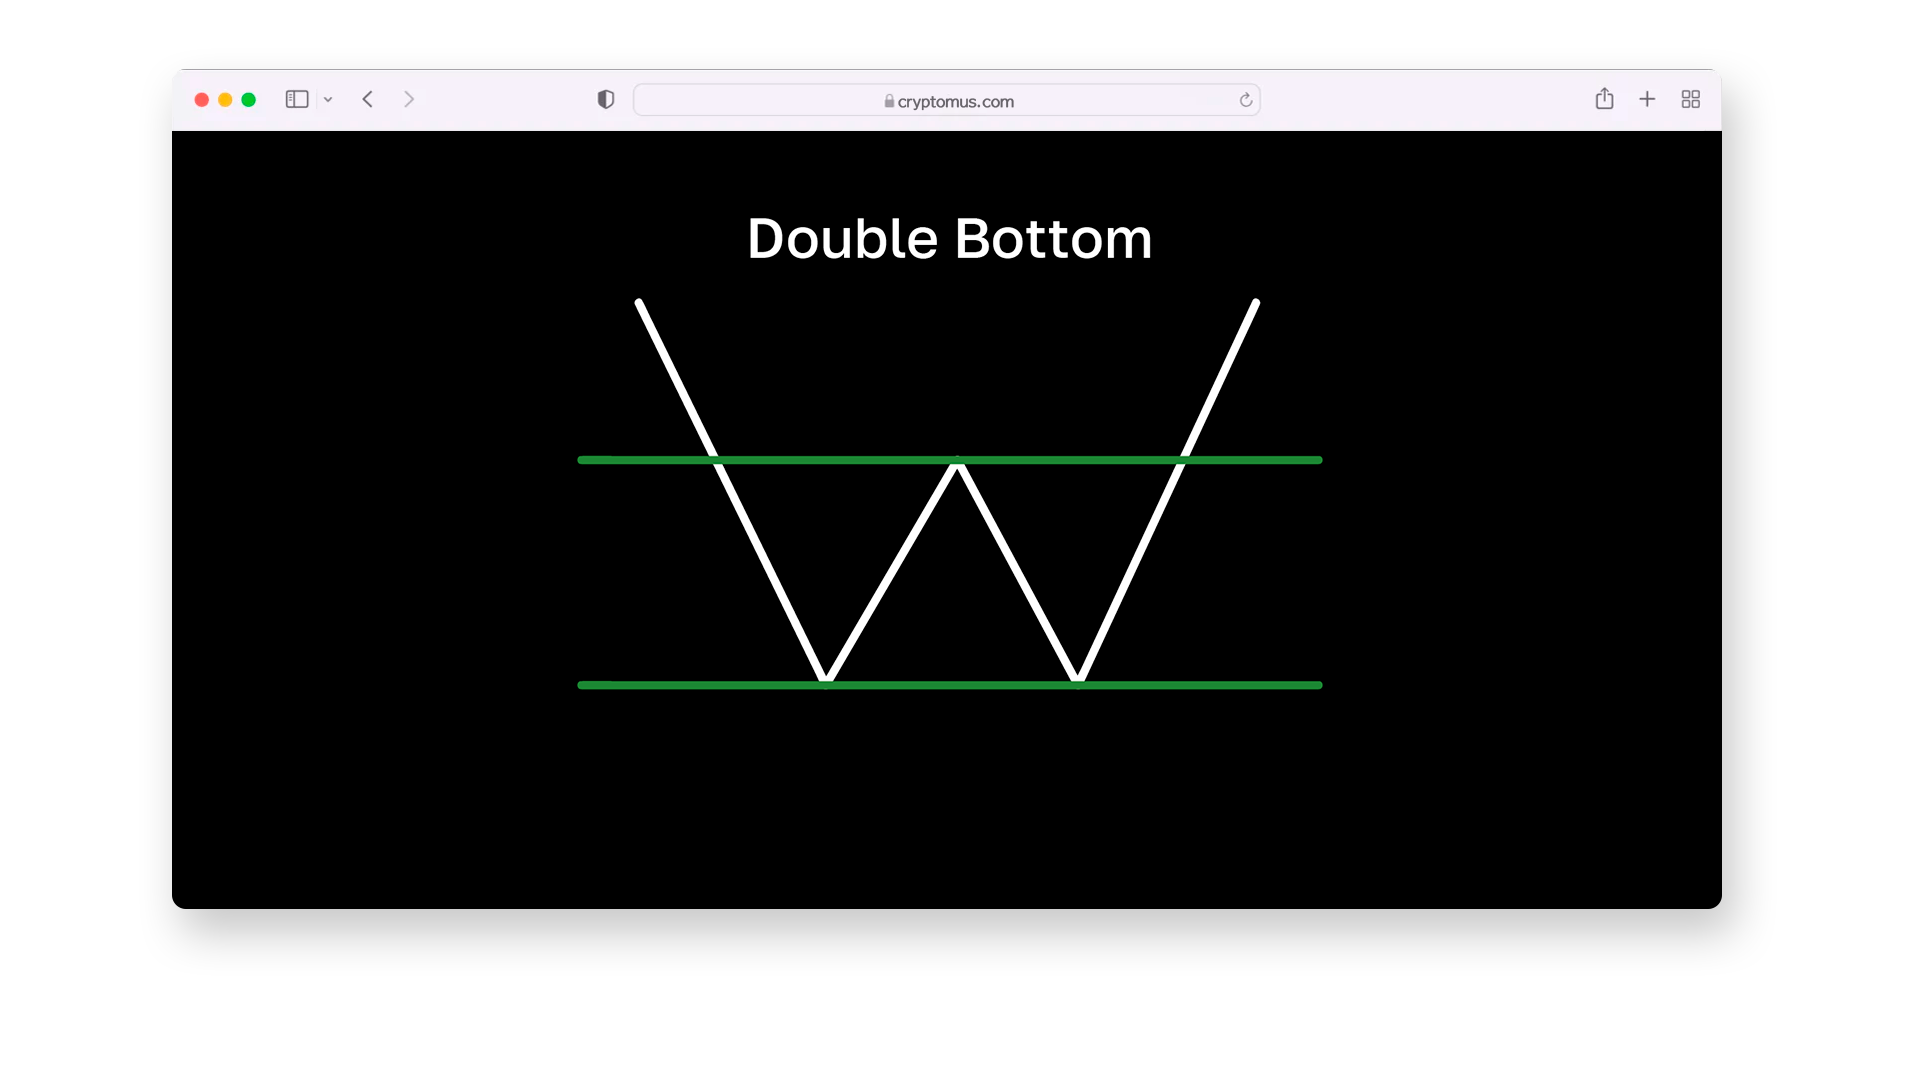
Once the market breaks through the resistance level, it will confirm a bullish reversal. It is worth buying on a break above the resistance line or on a pullback to the previous resistance line, which now acts as support after the breakout.
Thus, there are many chart patterns that you can find in trading. In our article, we have considered the most powerful and popular ones; you can check their effectiveness working on the Cryptomus exchange. There are a lot of pairs for trading, and the user-friendly interface will allow you to master the functionality in a matter of minutes.
What pattern do you use most often? Share your experience in the comments.


Simplify Your Crypto Journey
Want to store, send, accept, stake, or trade cryptocurrencies? With Cryptomus it's all possible — sign up and manage your cryptocurrency funds with our handy tools.
Get Started