

David McMillan
Crypto-enthusiast who explores all the possibilities the blockchain technology suggests
What Is Double Bottom (“W”) Pattern And How To Use It In Trading?
Table of Contents
The Double Bottom — the classic “W” pattern — is one of the most reliable signals that a downtrend is losing power and a reversal may be coming.
In crypto, where sharp drops and fast recoveries happen constantly, this pattern helps traders quickly spot when buyers are stepping back in and the market is preparing to turn upward.
Why is it labeled with the letter “W” and how to profit from the lows? You will find all the answers in this article.
What Is a Double Bottom Pattern?
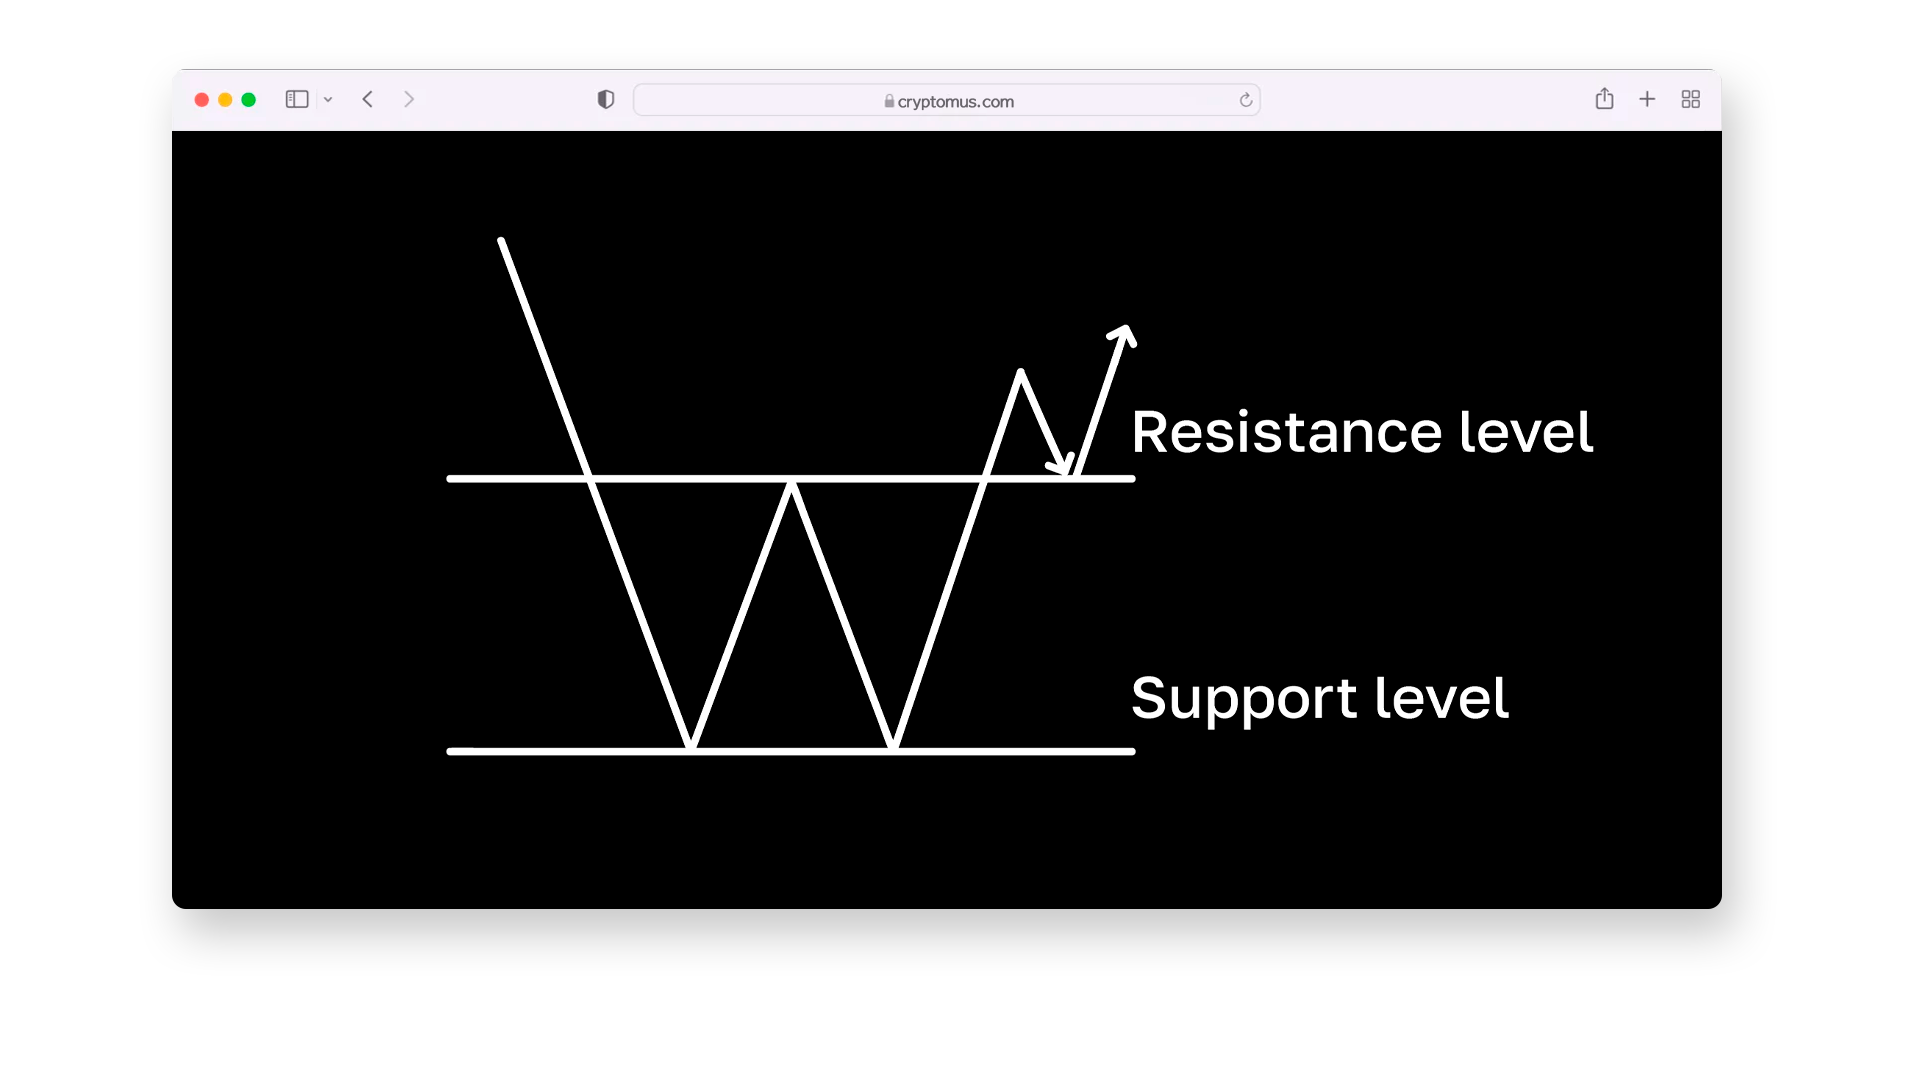
The Double Bottom pattern is a technical analysis chart that appears at a trend low in crypto and indicates a potential upward reversal, from bearish to bullish. This means that the downtrend is weakening and buying pressure is increasing. Traders often use this pattern as a signal to enter long positions i.e., trades that profit from rising prices.
This strategy is based on the formation of two price lows at approximately the same level. This is a critical support zone below which the price struggles to break. We can see a small upward peak between these lows that is trying to break the high. This structure gives the pattern designation with the letter “W” and from here came its name ”Double Bottom”.
The greater the distance between the two lows, the higher the chances of a trend reversal and successful pattern completion. The success happens because the bulls (buyers) demonstrate their strength and intention to push the price higher, preventing bears (sellers) from driving it lower. Buyers are called "bulls" because they charge forward and push prices up, while sellers are called "bears" because they swipe downward, dragging prices lower.
How to Identify the “W” Pattern?
Let's figure out how to identify this chart on the exchange. To do this, follow the next algorithm:
-
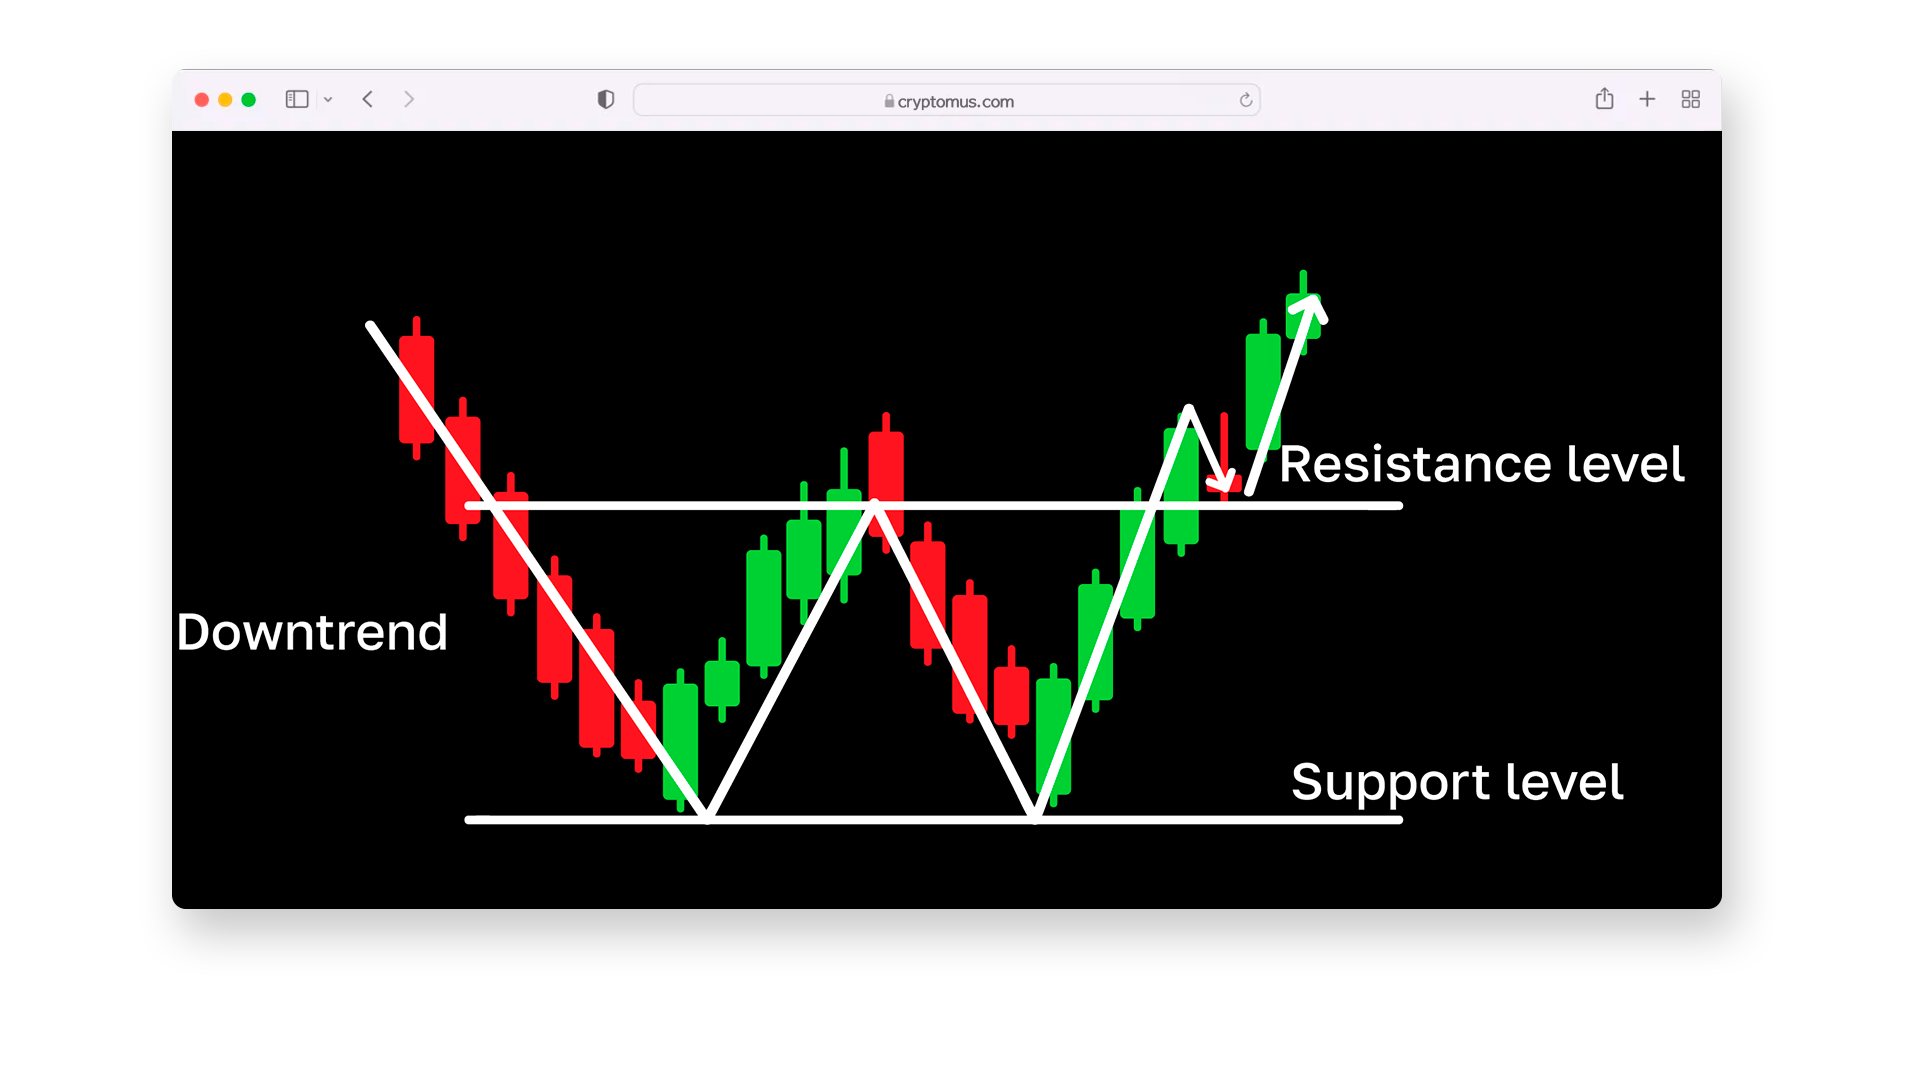
Spot the downtrend: Double Bottom forms after a steady price decline.
-
Look for two lows at the same level: the price reaches the first low (bottom), then bounces up. After a correction, it falls again to the same level but does not break through it.
-
Pay attention to the neckline: a small peak between two bottoms acts as a temporary resistance. If you draw a horizontal line at this level, you will find the neckline.
-
Wait for the breakout: if the price rises above the neckline after the second bottom, it signals for a reversal. Usually this occurs with an increase in volume at this time.
-
Confirm the pattern: sometimes after a breakout, the price returns to the neckline (retest) and bounces off it. If the neckline acts as support, it provides additional confirmation of the pattern and the transition to a bull market.
How to Use Double Bottom in Trading?
Now that you understand the basis and know how to find the “W” tactic on the chart, let’s move on to the most interesting part, the application of Double Bottom in trading. We have prepared a step-by-step guide so that you can identify and enter the trade at the right time:
-
Find the pattern on the chart: start by identifying a downtrend; two local bottoms should be around at the same level with a difference of no more than 5-10%. Look for a bounce to the neckline between them, which represents resistance. Watch it closely and avoid hasty decisions. Then wait for the price to break through the neckline.
-
Confirm the pattern: monitor the asset and its volume, which should increase when the price returns to the resistance level. Add a volume indicator to the chart for extra confirmation. If the volume on the second bottom is higher than on the first one and the price breaks the neckline, the pattern is confirmed.
-
Enter a trade: open a long position for further trading. Then set a stop-loss just below the resistance level and calculate the target price by adding the height of the pattern (the distance between the neckline and the lowest bottom) to the breakout point. Now you know how to get more profits.
To make it clearer, let's consider an example. At the first step, the asset falls from $30 to $25 and forms the first bottom. At the second step, it bounces to $27 at the resistance level, where the neckline appears. At the third step, the asset falls back to $25 and adds a second bottom but fails to break it. Next, at the final fourth step, the price rises above $27 with increasing volume, and pattern confirmation occurs. Thus, the potential profit will be approximately $2, which demonstrates the strategy’s operability.

Pros and Cons of the Double Bottom Pattern
Every financial instrument has its own advantages and disadvantages, and the Double Bottom pattern is no exception. Let's take a look at the characteristics of it in the table below:
| Aspect | Characteristics | |
|---|---|---|
| Pros | Clear entry and exit points: easy to determine the entry level, stop-loss, and take-profit. Used on different timeframes: works on both 5-minute and daily charts. Strong validation: once the pattern is validated, it gives a reliable indication of price movement direction. Confirmed by indicators: RSI, MACD, and volume can improve entry accuracy. Good risk/reward ratio: with proper management, you can earn 2 times as much. | |
| Cons | False breakouts: the price may break the neckline but then return lower due to lack of confirmation (volume, breakout). Forms slowly: on higher time frames, it can take days or weeks. |
The big advantage of this pattern is the versatility of time frames. You can use quick formations on a 5-minute chart, medium ones on a daily chart, and longer ones that extend to weeks. It often works this way: the larger the timeframe, the higher the potential profit. You can also make good money on shorter positions, especially if you open them frequently.
At the same time, no financial strategy is immune to losing profits, but you can significantly reduce your risks by additionally using confirming indicators such as RSI and MACD. RSI helps to identify a weakening downtrend through divergence, and MACD, on the other hand, confirms a change in momentum when its lines cross above the zero mark, signaling the growth of the upward momentum.

To sun up, the Double Bottom is a powerful and beginner-friendly pattern that helps traders recognize when the market is preparing for a potential upward reversal. It works especially well in crypto, where strong impulses and deep pullbacks often create ideal “W” formations. But like any tool, it’s most effective when paired with proper confirmation — volume, breakout above the neckline, and a solid risk-management plan.
If you want to get better at spotting and practicing Double Bottom setups, try analyzing real charts across multiple timeframes on Cryptomus Exchange. With consistent practice, you’ll learn to distinguish clean patterns from false signals and build more confident, structured trading decisions.


Simplify Your Crypto Journey
Want to store, send, accept, stake, or trade cryptocurrencies? With Cryptomus it's all possible — sign up and manage your cryptocurrency funds with our handy tools.
Get Started