
กิตติพงศ์ วัฒนชัย
ผู้เชี่ยวชาญด้านคริปโตที่อธิบายเทคโนโลยีบล็อกเชนให้เข้าใจง่ายและชัดเจน
ตัวบ่งชี้ที่ดีที่สุดสำหรับการเทรดคริปโตเคอร์เรนซี
สารบัญ
การนำทางในโลกของการเทรดคริปโตอาจเป็นงานที่ท้าทาย โดยเฉพาะเมื่อคำนึงถึงความผันผวนของตลาด หนึ่งในวิธีที่ทรงพลังที่สุดในการสร้างความได้เปรียบในฐานะเทรดเดอร์คือการใช้ อินดิเคเตอร์การเทรด
เครื่องมือเหล่านี้ช่วยให้คุณวิเคราะห์แนวโน้มของตลาด ทำความเข้าใจ price action และตัดสินใจอย่างมีข้อมูล ซึ่งสามารถนำไปสู่การเทรดที่ประสบความสำเร็จมากขึ้น ในบทความนี้ เราจะสำรวจอินดิเคเตอร์ที่มีประสิทธิภาพที่สุดในการใช้สำหรับการเทรดคริปโต และวิธีที่มันช่วยเสริม กลยุทธ์ ของคุณ
อินดิเคเตอร์ในการเทรดคืออะไร?
อินดิเคเตอร์การเทรดคือสูตรทางคณิตศาสตร์ที่ช่วยให้คุณมองเห็นข้อมูลบน กราฟคริปโต พวกมันช่วยระบุสัญญาณที่เป็นไปได้ แนวโน้ม และการเปลี่ยนแปลงของ momentum พูดง่ายๆ อินดิเคเตอร์การเทรดให้ข้อมูลเชิงลึกเกี่ยวกับช่วงเวลาที่การเคลื่อนไหวของตลาดอาจเกิดขึ้น โดยอ้างอิงจากข้อมูลในอดีต เช่น ความผันผวนของราคาและ volume ข้อมูลนี้ช่วยให้เทรดเดอร์เข้าใจสถานการณ์ตลาดปัจจุบันและคาดการณ์พฤติกรรมในอนาคต โดยเฉพาะในบริบทของ ความผันผวน ที่นิยามตลาดคริปโต
อินดิเคเตอร์ถือว่าจำเป็นต่อการตัดอารมณ์ออกจากกระบวนการตัดสินใจ พวกมันให้ข้อมูลเชิงวัตถุประสงค์จากข้อมูลจริง ช่วยให้เทรดเดอร์หลีกเลี่ยงการพึ่งพาความรู้สึกหรืออคติส่วนตัว ด้วยการใช้อินดิเคเตอร์ที่เหมาะสม คุณสามารถระบุแนวโน้มได้ตั้งแต่เนิ่นๆ ตรวจจับการเปลี่ยนแปลงของ momentum และแม้กระทั่งทำนายการกลับตัว สิ่งนี้ช่วยให้เทรดเดอร์สร้างกลยุทธ์ที่มีวินัยและมีข้อมูลสนับสนุน ซึ่งเหมาะสมกับความผันผวนอันเป็นเอกลักษณ์ของตลาดคริปโต
วิเคราะห์ตลาดคริปโตได้อย่างง่ายดาย ใช้กราฟตลาด อินดิเคเตอร์ และเครื่องมือขั้นสูงเพื่อเทรดบน Cryptomus
รายชื่ออินดิเคเตอร์ที่ดีที่สุด
นี่คือ 10 อินดิเคเตอร์ที่ถูกใช้กันอย่างกว้างขวางที่สุดในการเทรดคริปโต:
- Moving Average (MA)
- Relative Strength Index (RSI)
- Moving Average Convergence Divergence (MACD)
- Bollinger Bands
- Fibonacci Retracement
- Stochastic Oscillator
- Ichimoku Cloud
- Parabolic SAR
- On-Balance Volume (OBV)
- Average Directional Index (ADX)
ต่อไปเราจะมาดูรายละเอียดของแต่ละอินดิเคเตอร์ และวิธีที่พวกมันสามารถช่วยคุณพัฒนากลยุทธ์การเทรดได้

Moving Average (MA)
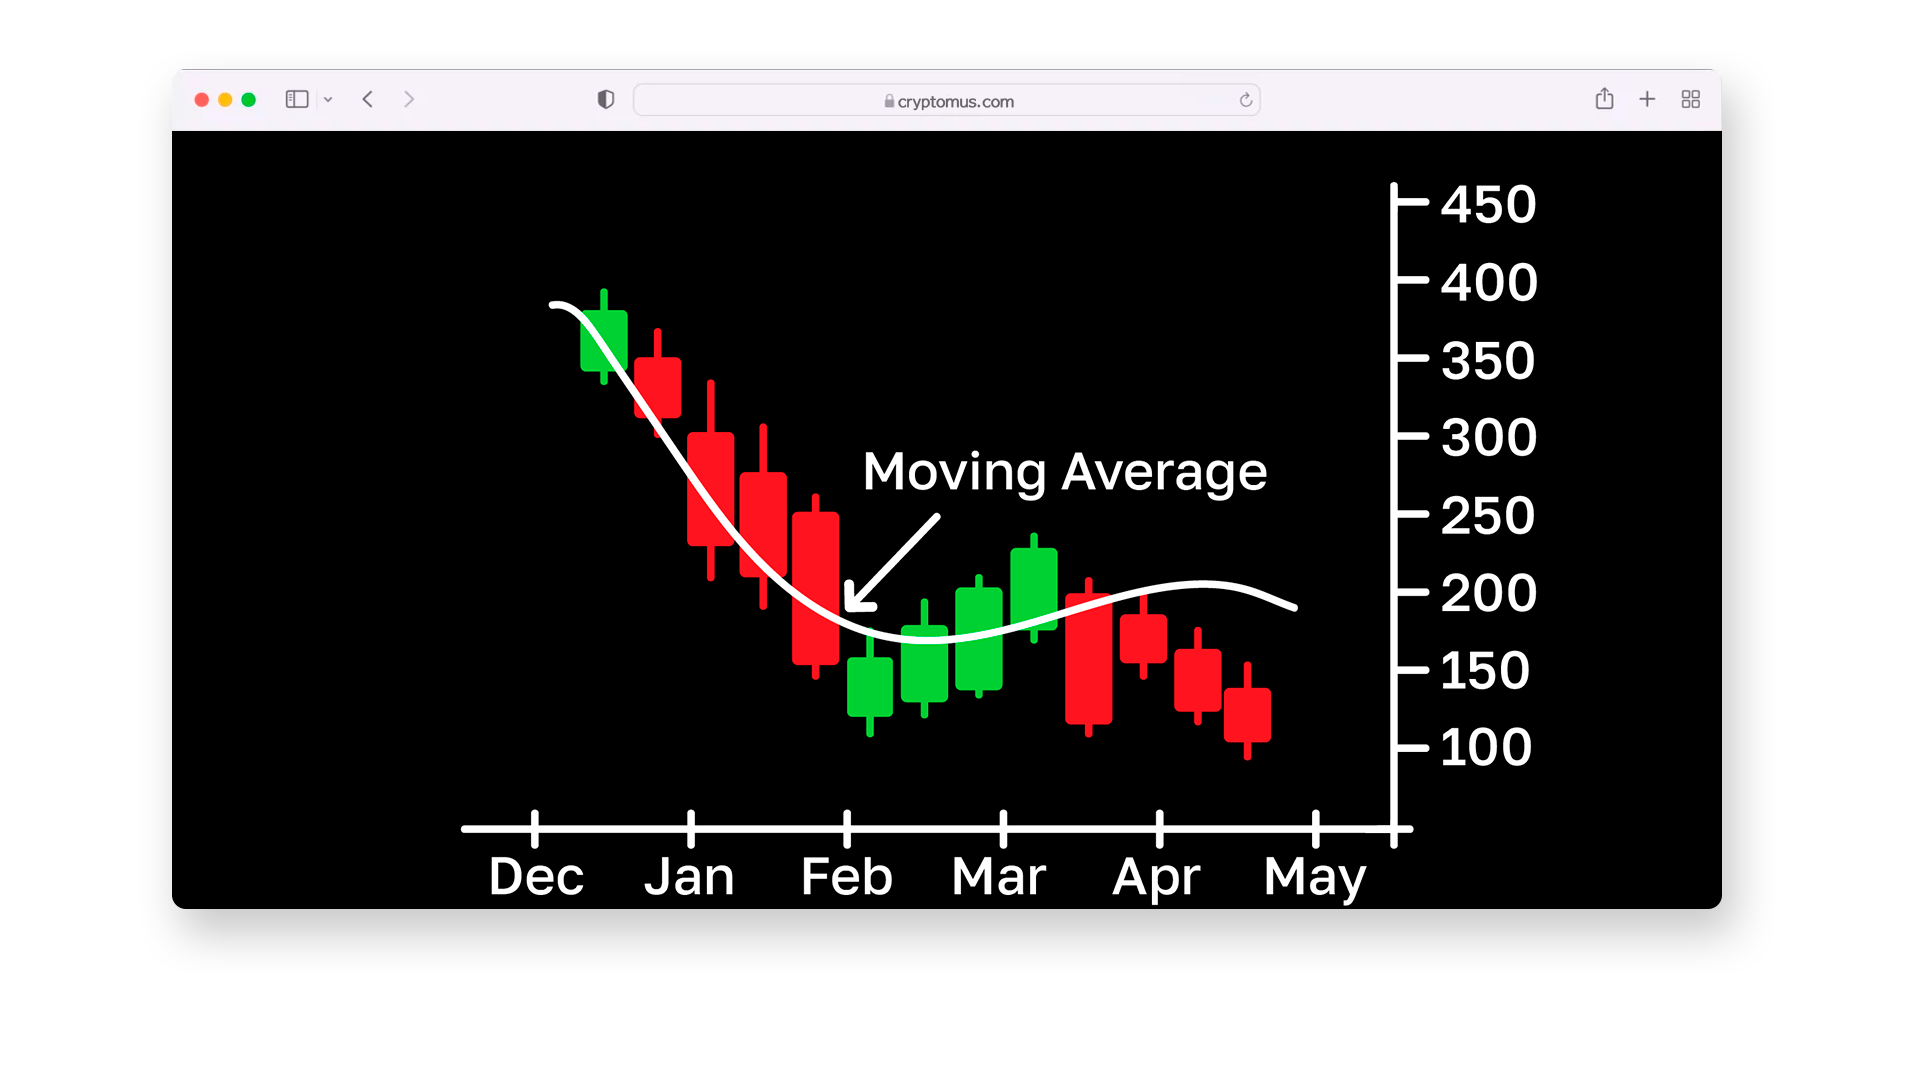
Moving Average (MA) เป็นอินดิเคเตอร์ที่ช่วยปรับความผันผวนของราคาให้นุ่มนวลขึ้น และช่วยระบุแนวโน้มหลักของตลาด
แก่นสำคัญของ MA คือแสดงทิศทางตลาด หากราคาสูงกว่า MA อาจบ่งบอกถึงขาขึ้น แต่ถ้าต่ำกว่า MA อาจบ่งบอกถึงขาลง ค่าเฉลี่ยเคลื่อนที่จะกรองความผันผวนแบบสุ่มออก เผยให้เห็นแนวโน้มหลัก และยังใช้ยืนยันสัญญาณซื้อหรือขาย เช่น เมื่อราคาตัดผ่าน MA ในการวิเคราะห์ตลาดคริปโต มักใช้ค่า 50-day Moving Average (50 MA) และ 200-day Moving Average (200 MA)
MA คำนวณโดยนำราคามารวมกันในช่วงเวลาที่เลือก (n) แล้วหารด้วยจำนวนรอบ “n” คือช่วงเวลาที่เลือก และผลลัพธ์คือราคาเฉลี่ยของช่วงนั้น
Relative Strength Index (RSI)
Relative Strength Index (RSI) เป็นอินดิเคเตอร์ที่วัดความเร็วและขนาดของการเปลี่ยนแปลงราคา เพื่อระบุภาวะ overbought หรือ oversold ในตลาด
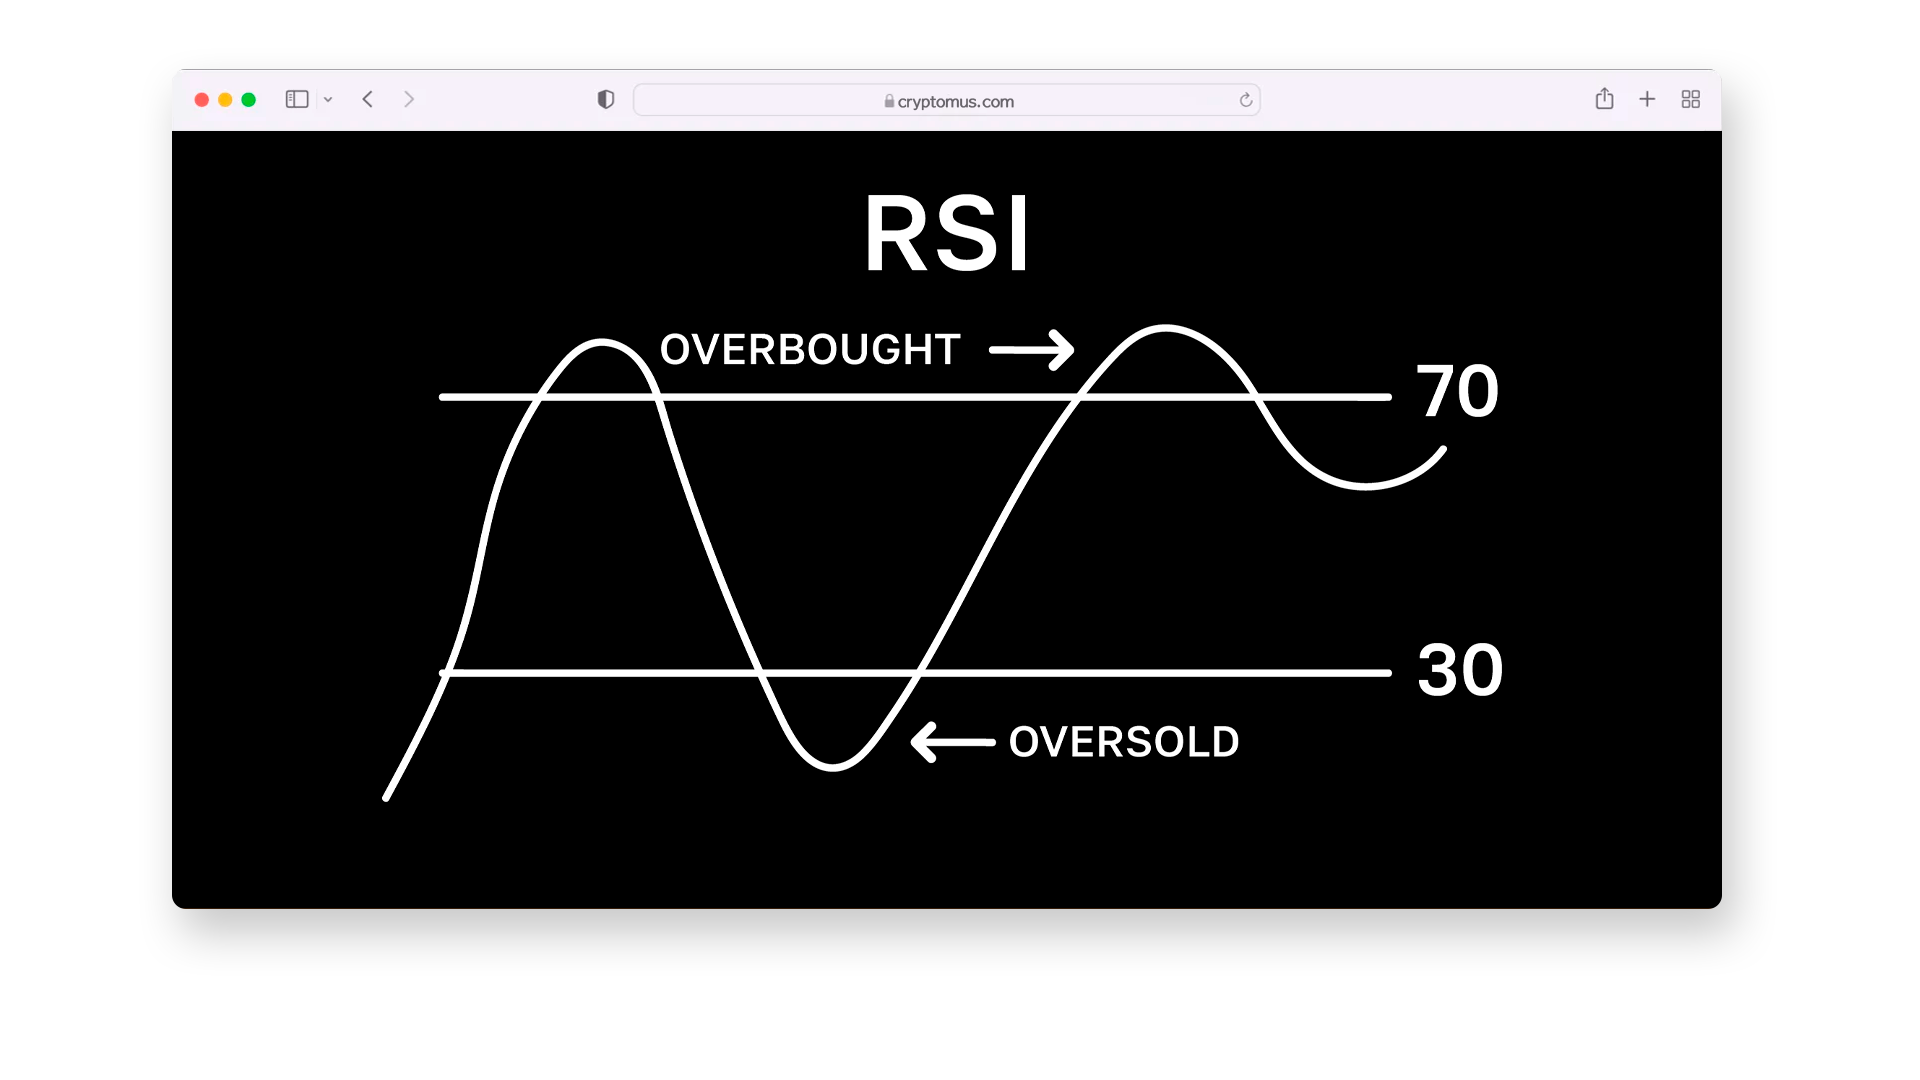
RSI ประเมิน momentum ถ้าค่าสูงกว่า 70 อาจบ่งบอกว่าสินทรัพย์ถูกซื้อมากเกินไปและอาจเกิดการปรับฐานราคา ในขณะที่ค่าต่ำกว่า 30 อาจบ่งบอกว่าสินทรัพย์ถูกขายมากเกินไปและอาจเกิดการรีบาวด์ RSI จึงช่วยให้เทรดเดอร์ระบุการกลับตัวหรือยืนยันแนวโน้มโดยวิเคราะห์ความแข็งแกร่งของการเคลื่อนไหวล่าสุด
Moving Average Convergence Divergence (MACD)
MACD เป็นอินดิเคเตอร์ที่แสดงความสัมพันธ์ระหว่างค่าเฉลี่ยเคลื่อนที่สองเส้นของราคา เพื่อระบุการเปลี่ยนแปลงของแนวโน้มและ momentum
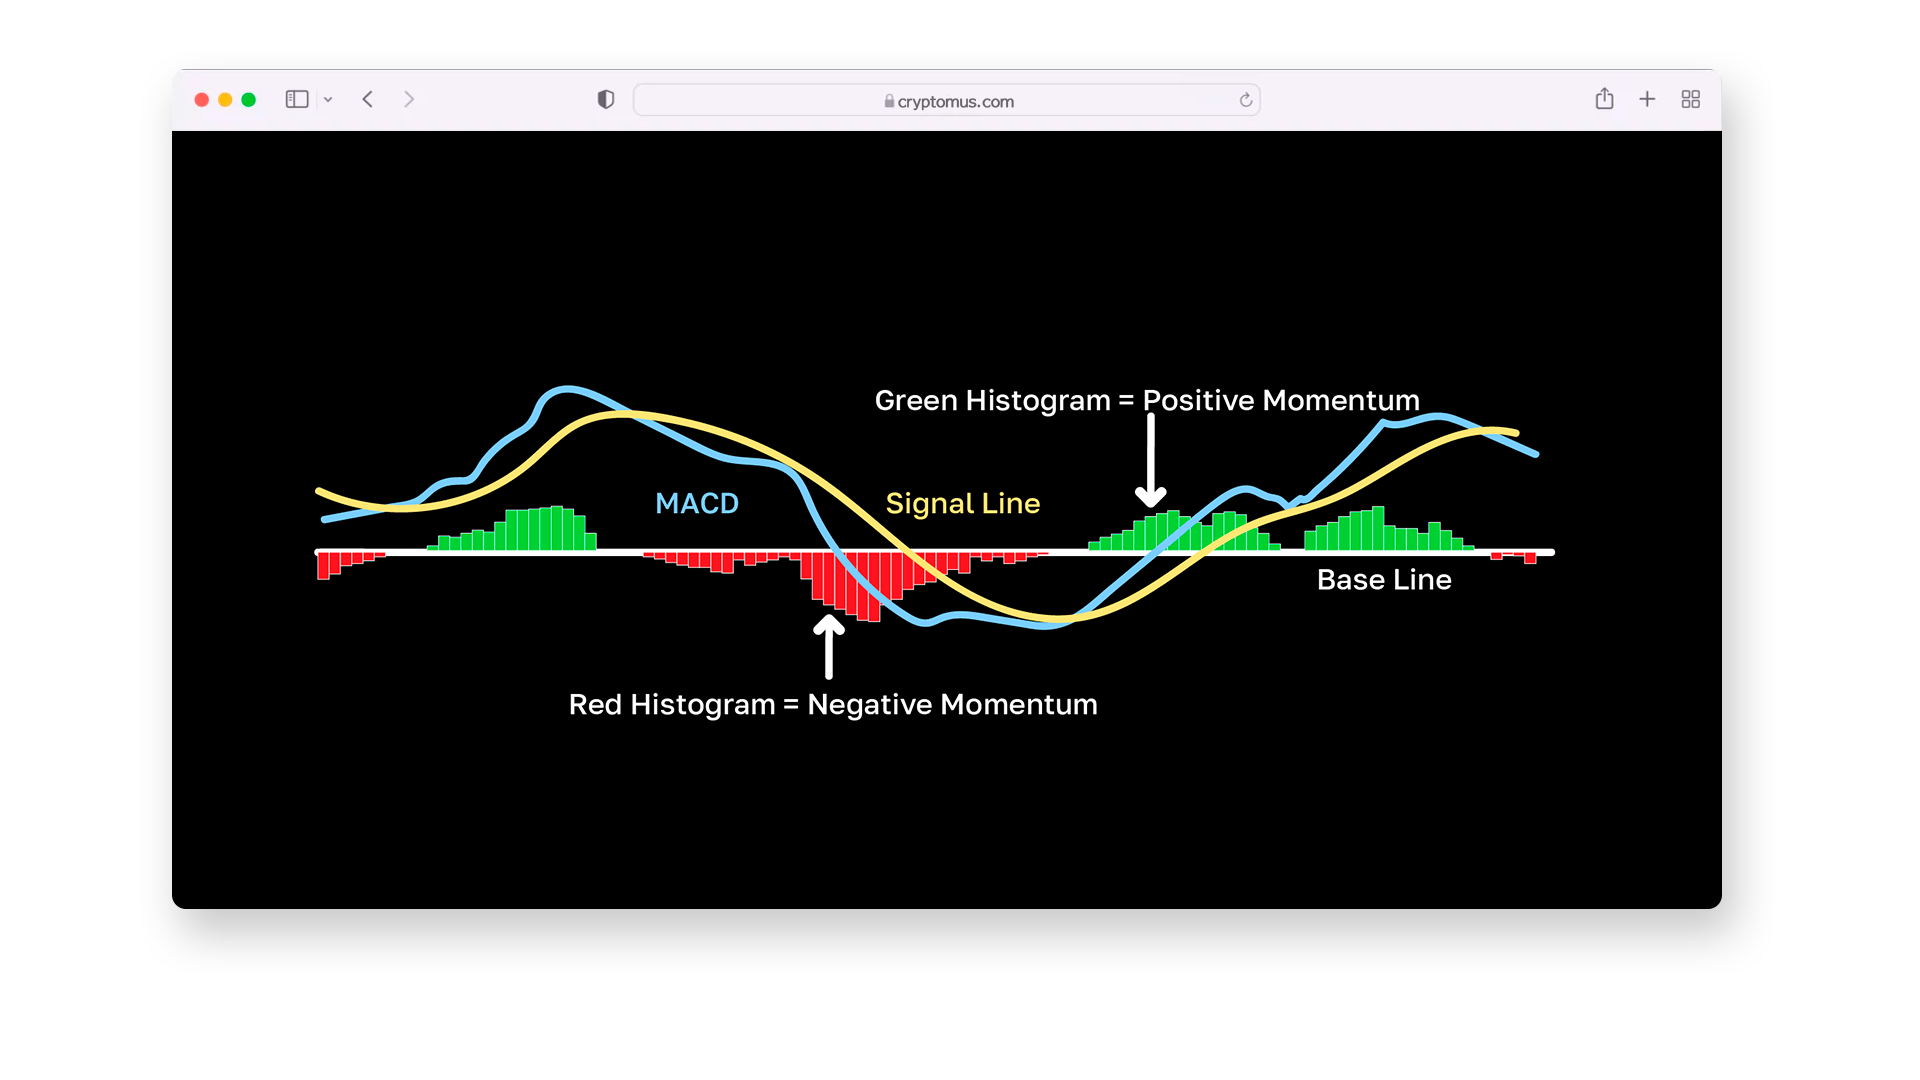
MACD เน้นช่วงที่เทรนด์แข็งแกร่งขึ้นหรืออ่อนแรงลง ประกอบด้วย 3 ส่วนคือ เส้น MACD (ส่วนต่างของ MA สองเส้น), เส้นสัญญาณ (MA ของเส้น MACD), และฮิสโตแกรม (ส่วนต่างระหว่างเส้น MACD กับเส้นสัญญาณ) หากเส้น MACD ตัดขึ้นเหนือเส้นสัญญาณ อาจเป็นสัญญาณ bullish แต่หากตัดลงต่ำกว่า อาจเป็นสัญญาณ bearish
Bollinger Bands
Bollinger Bands เป็นอินดิเคเตอร์ที่วัดความผันผวนของราคา โดยใช้ค่าเฉลี่ยเคลื่อนที่และเส้นเบี่ยงเบนมาตรฐานสองเส้น
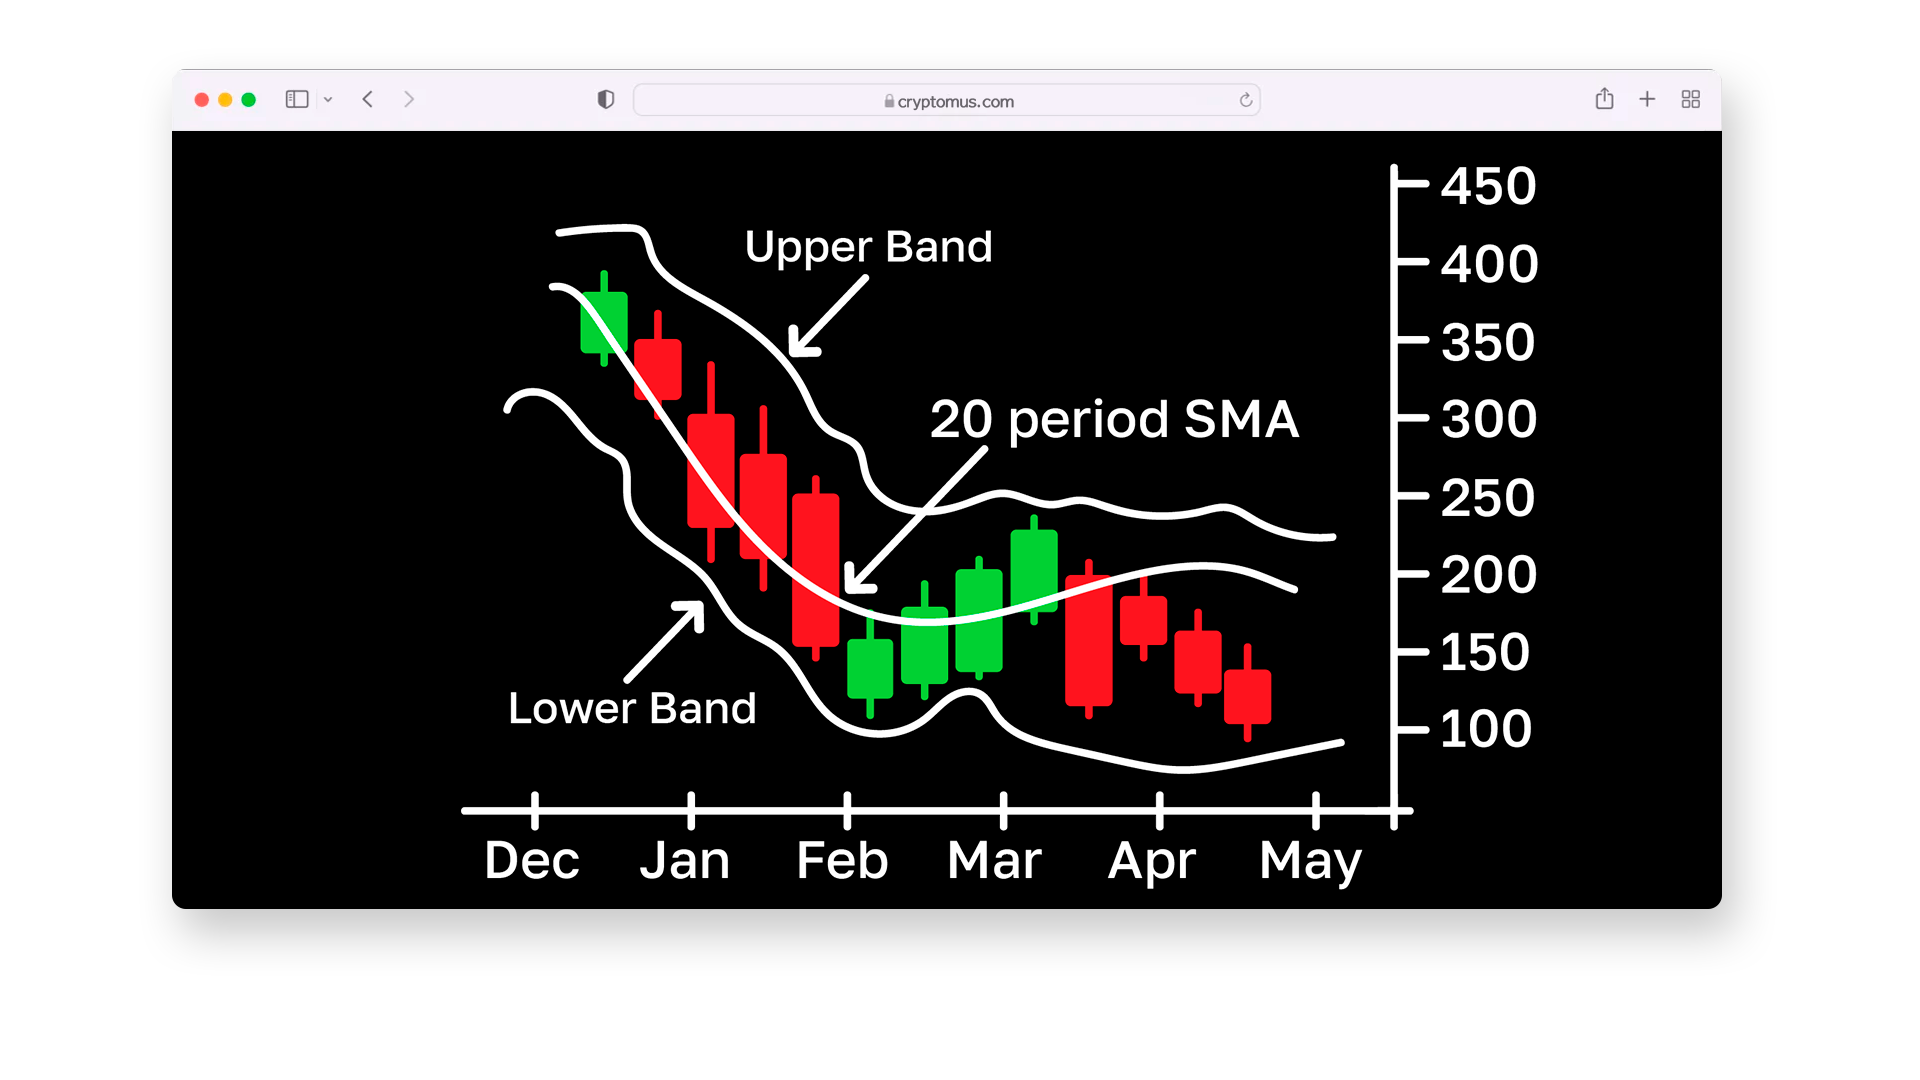
เมื่อแถบกว้างขึ้น หมายถึงความผันผวนสูง เมื่อแคบลง หมายถึงความผันผวนต่ำ ราคาที่เข้าใกล้แถบบนบ่งบอกภาวะ overbought ส่วนใกล้แถบล่างบ่งบอกภาวะ oversold
Fibonacci Retracement
Fibonacci Retracement เป็นเครื่องมือที่ใช้ระบุแนวรับและแนวต้าน โดยอ้างอิงจากลำดับฟีโบนัชชี
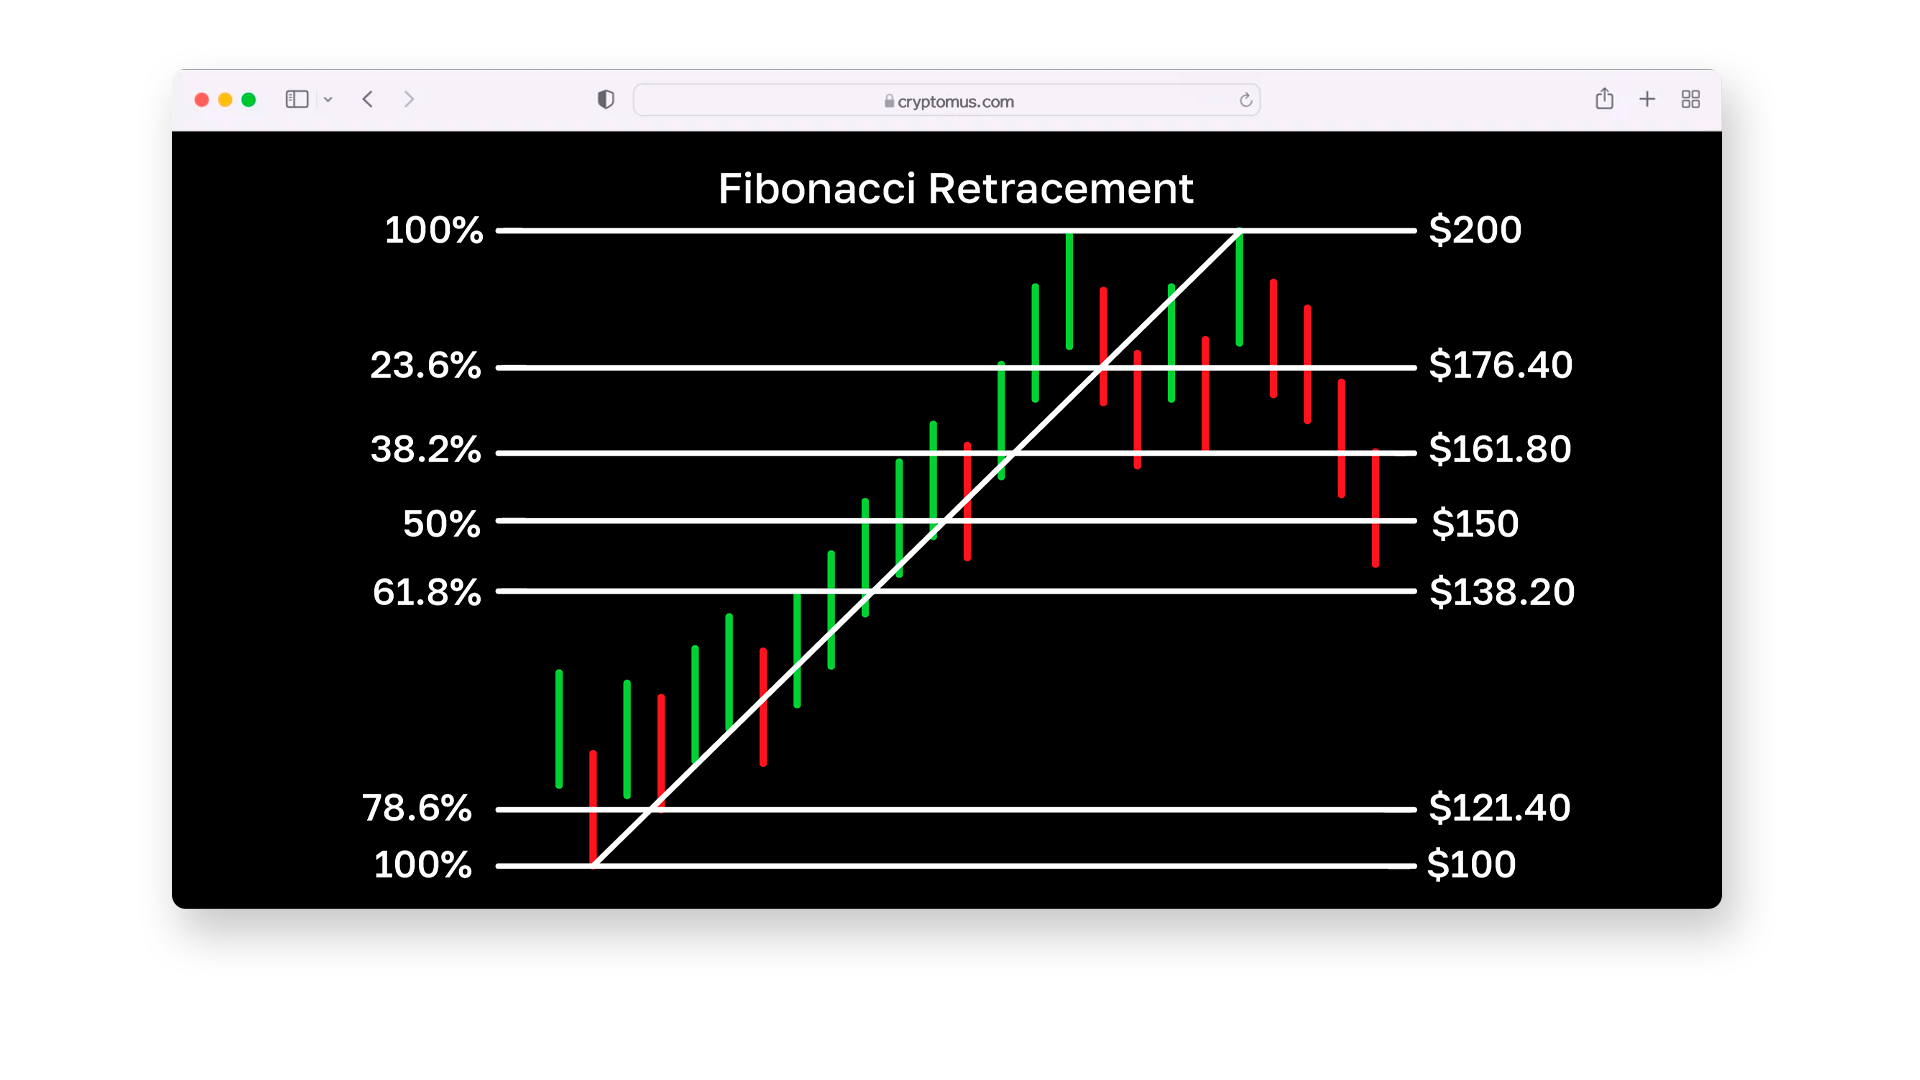
ใช้เพื่อทำนายว่าราคาอาจหยุดหรือกลับตัวที่จุดใด โดยระดับยอดนิยมคือ 23.6%, 38.2%, 50%, 61.8% และ 78.6%
Stochastic Oscillator
Stochastic Oscillator เป็นอินดิเคเตอร์ที่วัดตำแหน่งราคาปัจจุบันเมื่อเทียบกับกรอบราคาในช่วงเวลา เพื่อระบุภาวะ overbought หรือ oversold
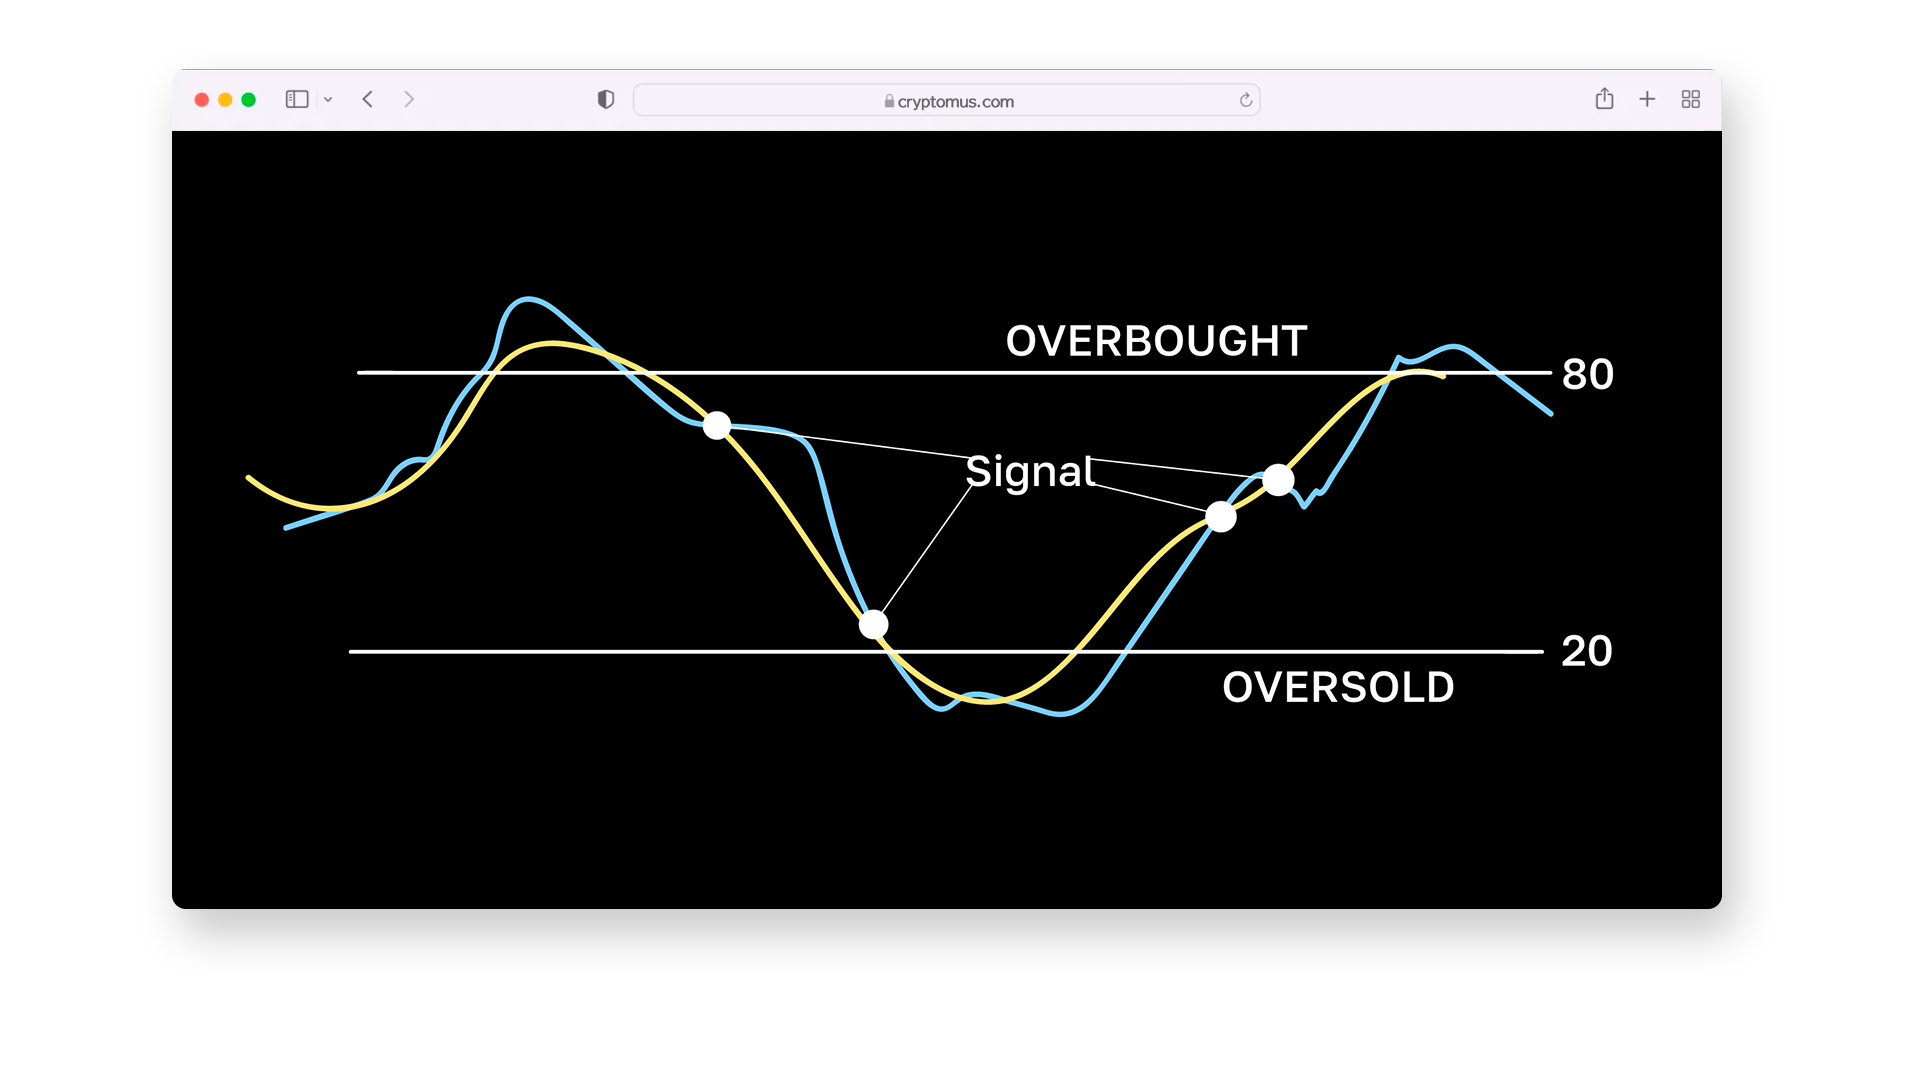
ค่ามากกว่า 80 บ่งบอก overbought ค่าต่ำกว่า 20 บ่งบอก oversold เทรดเดอร์ใช้การตัดกันของเส้น %K และ %D เป็นสัญญาณซื้อหรือขาย
Ichimoku Cloud
Ichimoku Cloud เป็นอินดิเคเตอร์แบบครบวงจรที่ให้ข้อมูลเกี่ยวกับแนวโน้ม Momentum และแนวรับแนวต้าน
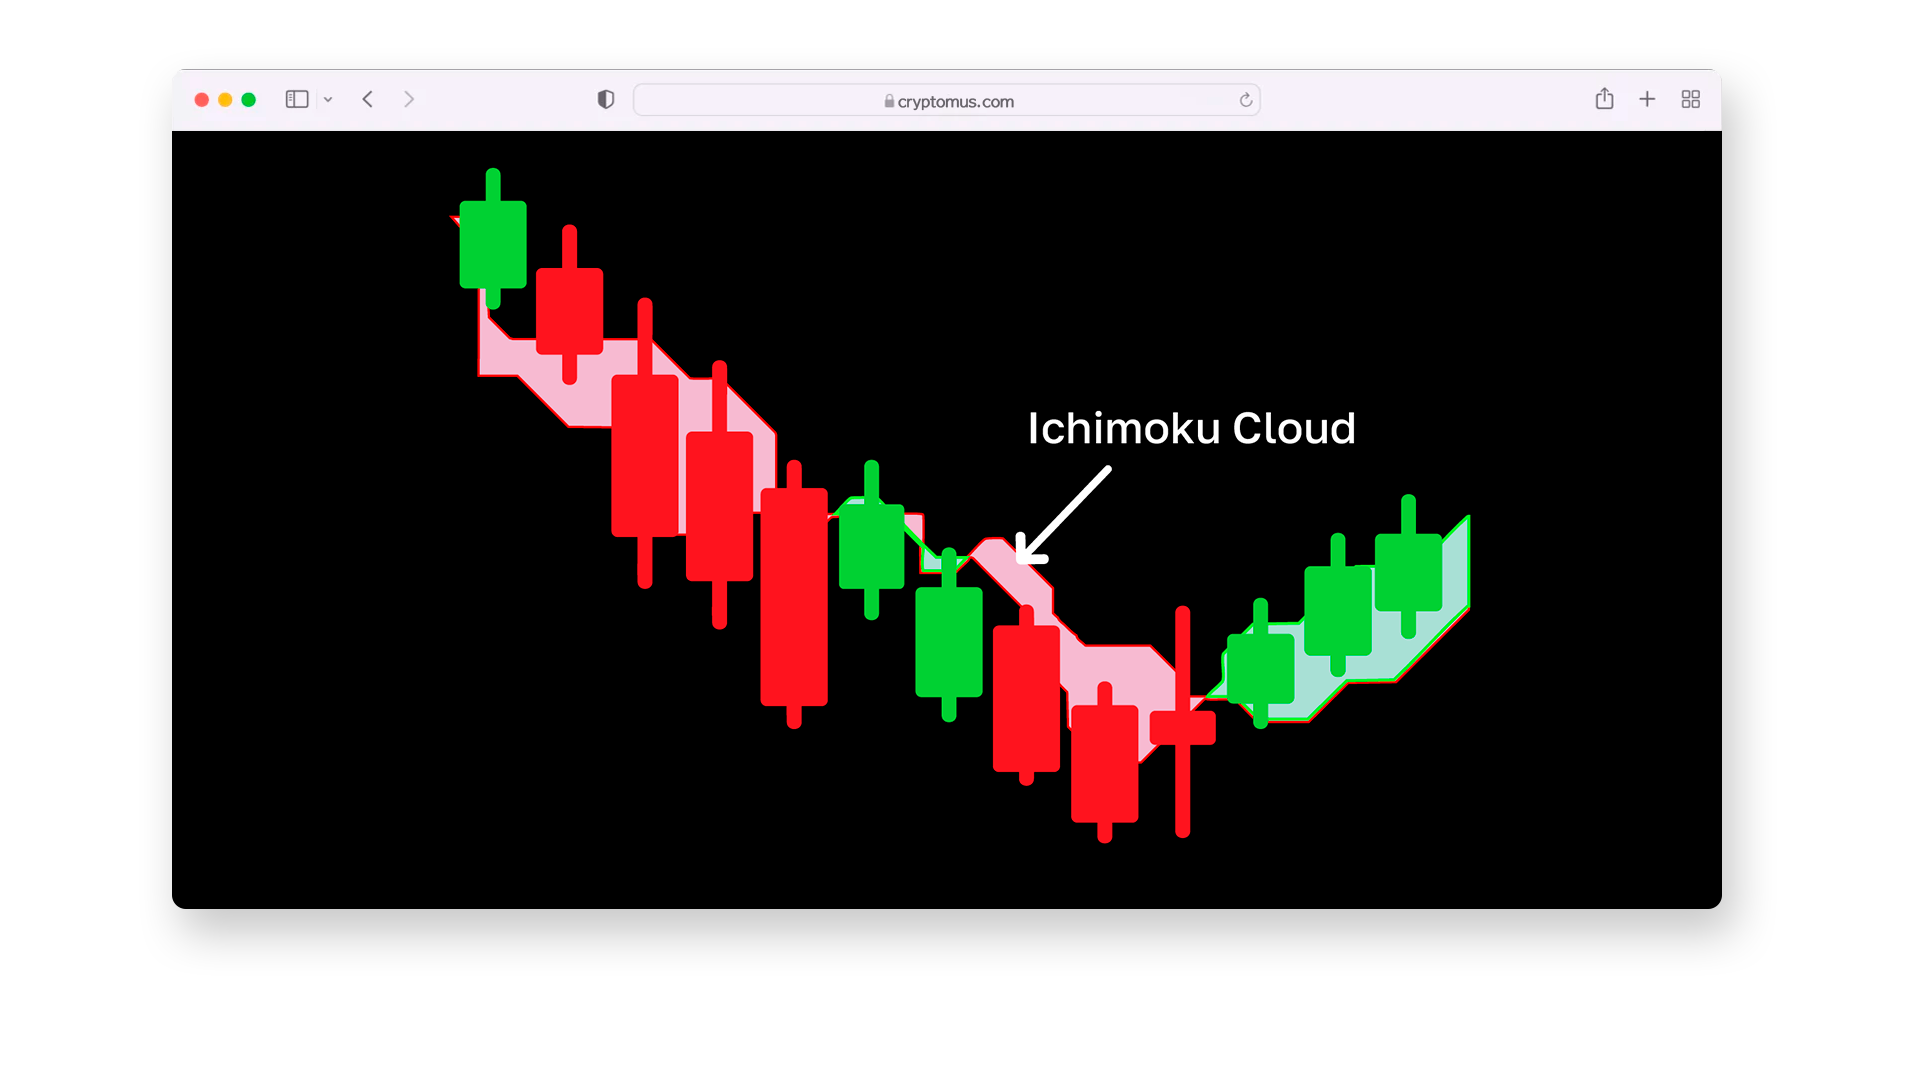
หากราคาอยู่เหนือเมฆ แสดงถึงขาขึ้น หากต่ำกว่า แสดงถึงขาลง ความหนาของเมฆสะท้อนความแข็งแรงของแนวรับแนวต้าน
Parabolic SAR
Parabolic SAR (Stop and Reverse) เป็นอินดิเคเตอร์ที่ช่วยระบุทิศทางของเทรนด์และจุดที่อาจกลับตัว
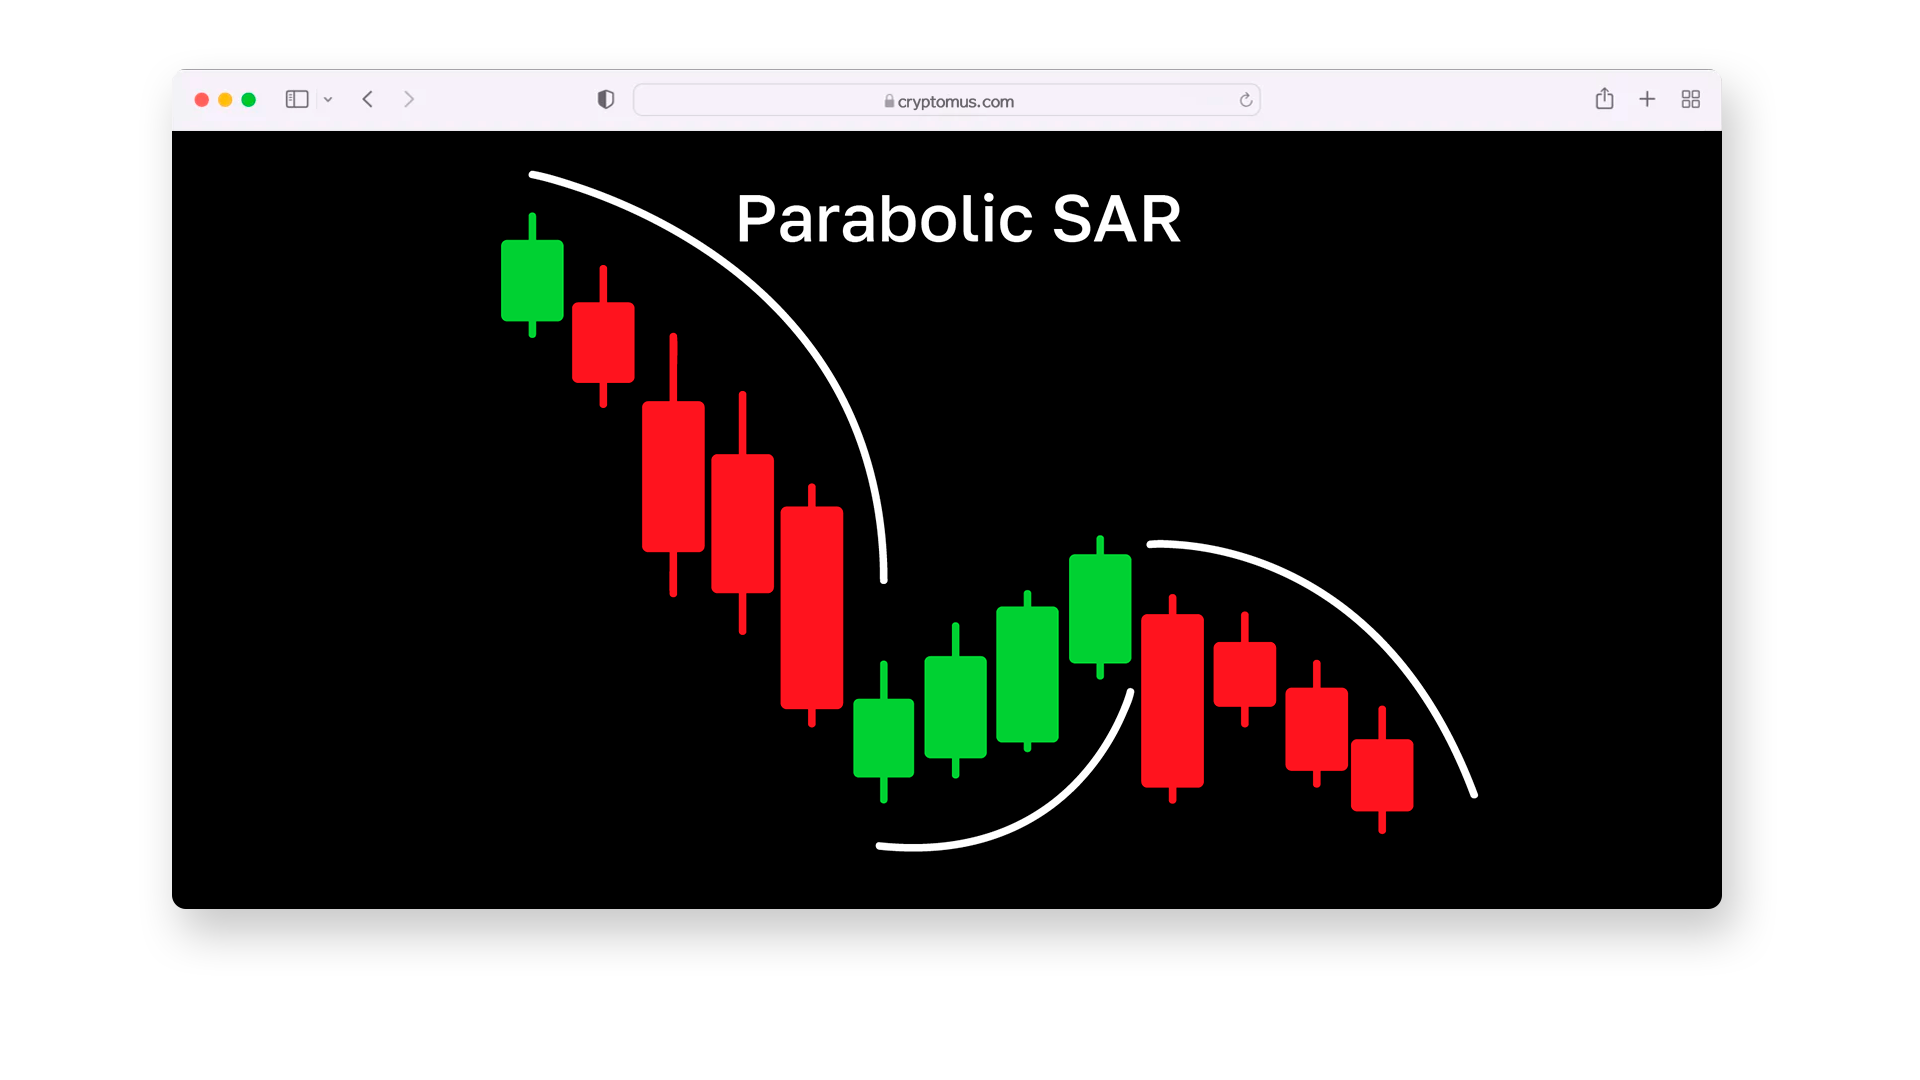
แสดงจุดบนหรือล่างราคาตามทิศทางของเทรนด์ จุดที่สลับตำแหน่งหมายถึงโอกาสการกลับตัว
On-Balance Volume (OBV)
On-Balance Volume เป็นอินดิเคเตอร์ที่วัดแรงกดดันการซื้อและขาย โดยวิเคราะห์ volume เทียบกับการเคลื่อนไหวราคา
OBV ที่เพิ่มขึ้นหมายถึงแรงซื้อ OBV ที่ลดลงหมายถึงแรงขาย เทรดเดอร์ใช้ OBV เพื่อยืนยันแนวโน้มหรือหาความต่างระหว่างราคาและ volume
Average Directional Index (ADX)
ADX เป็นอินดิเคเตอร์ที่วัดความแข็งแกร่งของแนวโน้ม ไม่ว่าจะเป็นขาขึ้นหรือขาลง
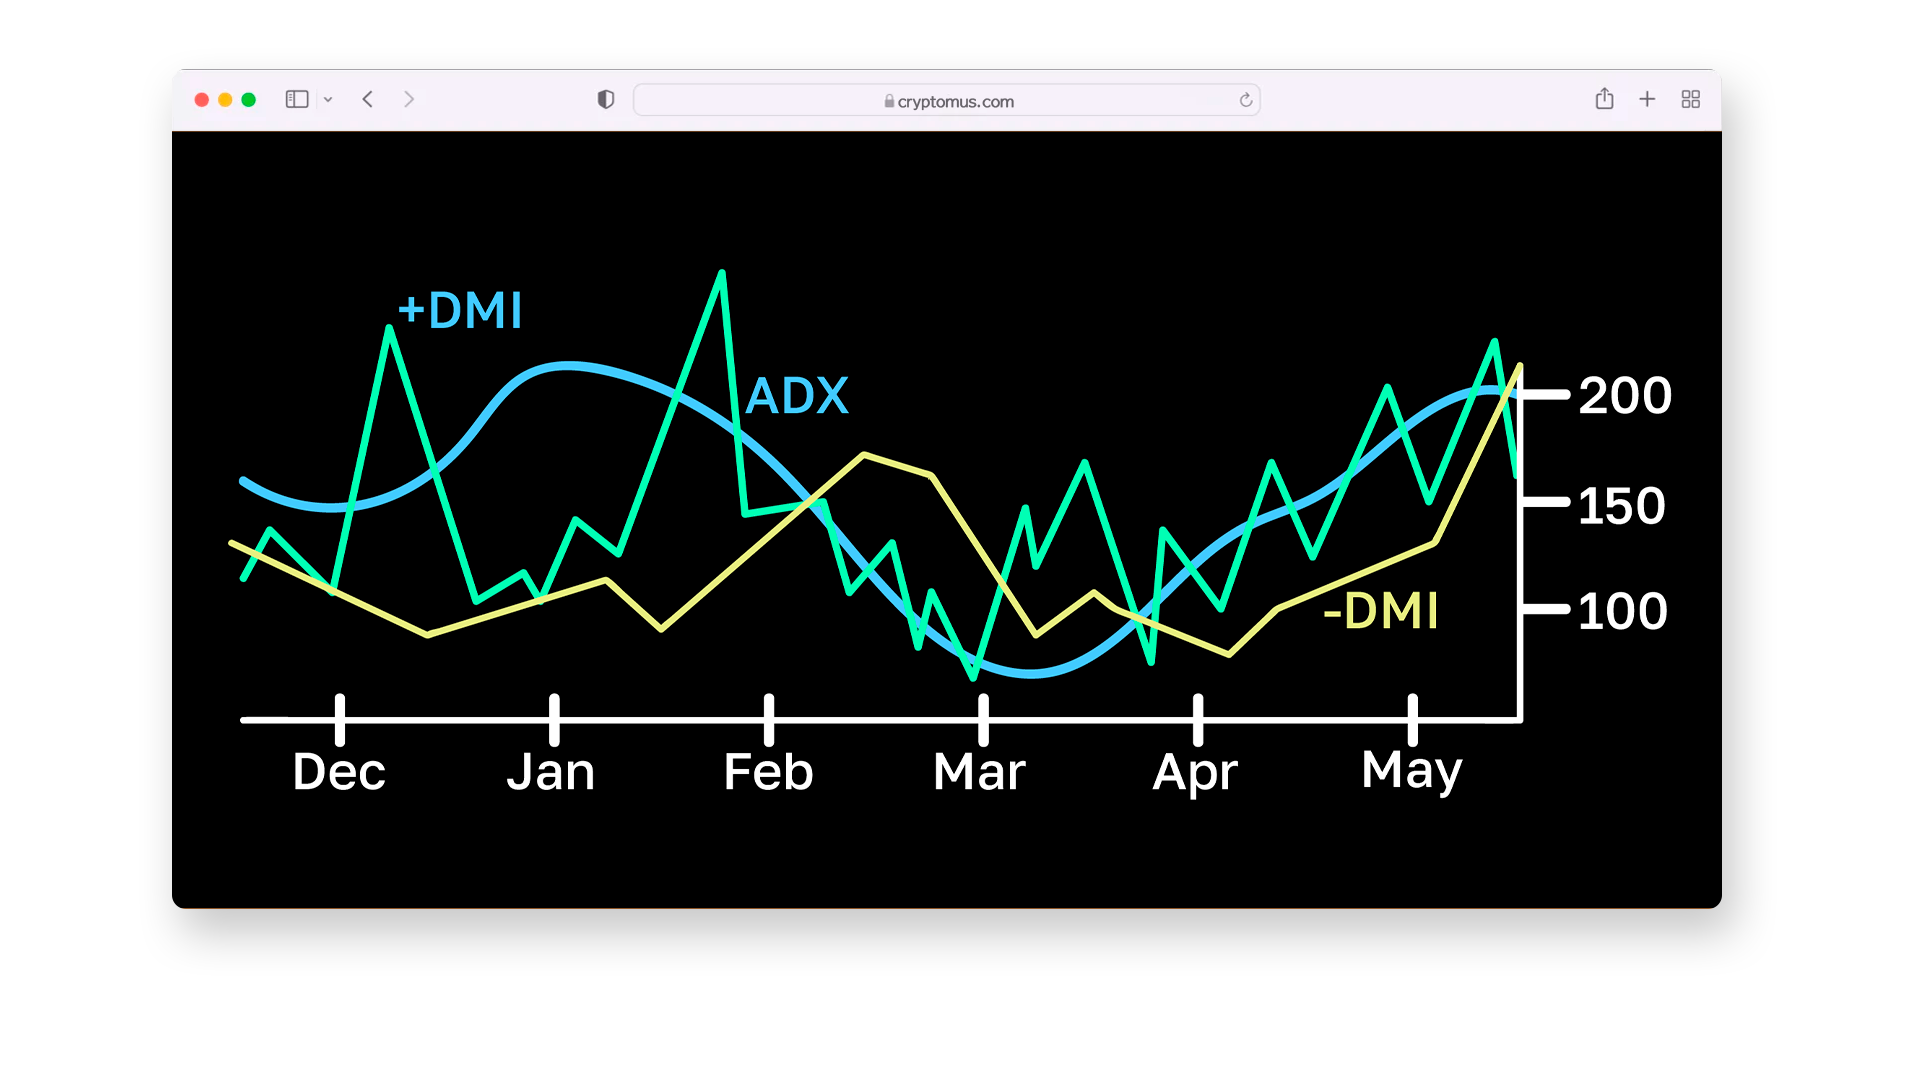
ค่า ADX สูงกว่า 25 แสดงถึงเทรนด์ที่แข็งแรง ค่าต่ำกว่า 20 แสดงถึงตลาด sideway มักใช้ร่วมกับ +DI และ -DI เพื่อระบุทั้งทิศทางและความแข็งแรงของเทรนด์
ดังนั้น เราได้สำรวจอินดิเคเตอร์ 10 ตัวที่ดีที่สุดในการเทรดคริปโต แต่ละตัวมอบข้อมูลเชิงลึกเกี่ยวกับแนวโน้ม Momentum ความผันผวน และจุดเข้าออกที่เป็นไปได้ หากใช้มันอย่างมีประสิทธิภาพ เทรดเดอร์สามารถเสริมกระบวนการตัดสินใจ ระบุโอกาสในตลาด และจัดการความเสี่ยงได้ดีขึ้น
เราหวังว่าคู่มือนี้จะเป็นประโยชน์ในการขยายชุดเครื่องมือการเทรดของคุณ ขอบคุณที่อ่าน!

ทำให้การเดินทางสู่ Crypto ของคุณง่ายขึ้น
อยากเก็บ ส่ง รับ เดิมพัน หรือซื้อขายคริปโทเคอร์เรนซีใช่ไหม? Cryptomus ทำได้ทุกอย่าง — สมัครและจัดการกองทุนคริปโทเคอร์เรนซีของคุณด้วยเครื่องมืออันแสนสะดวกของเรา
เริ่มต้นใช้งาน