
暗号資産の世界には、トレーダーが有利に取引するために役立つ多くのパターンがあります。この記事では、ダイヤモンドパターンについて—それが何か、どのような形か、そしてトレードでの活用法—を解説します。さっそく始めましょう!
ダイヤモンドパターンとは?
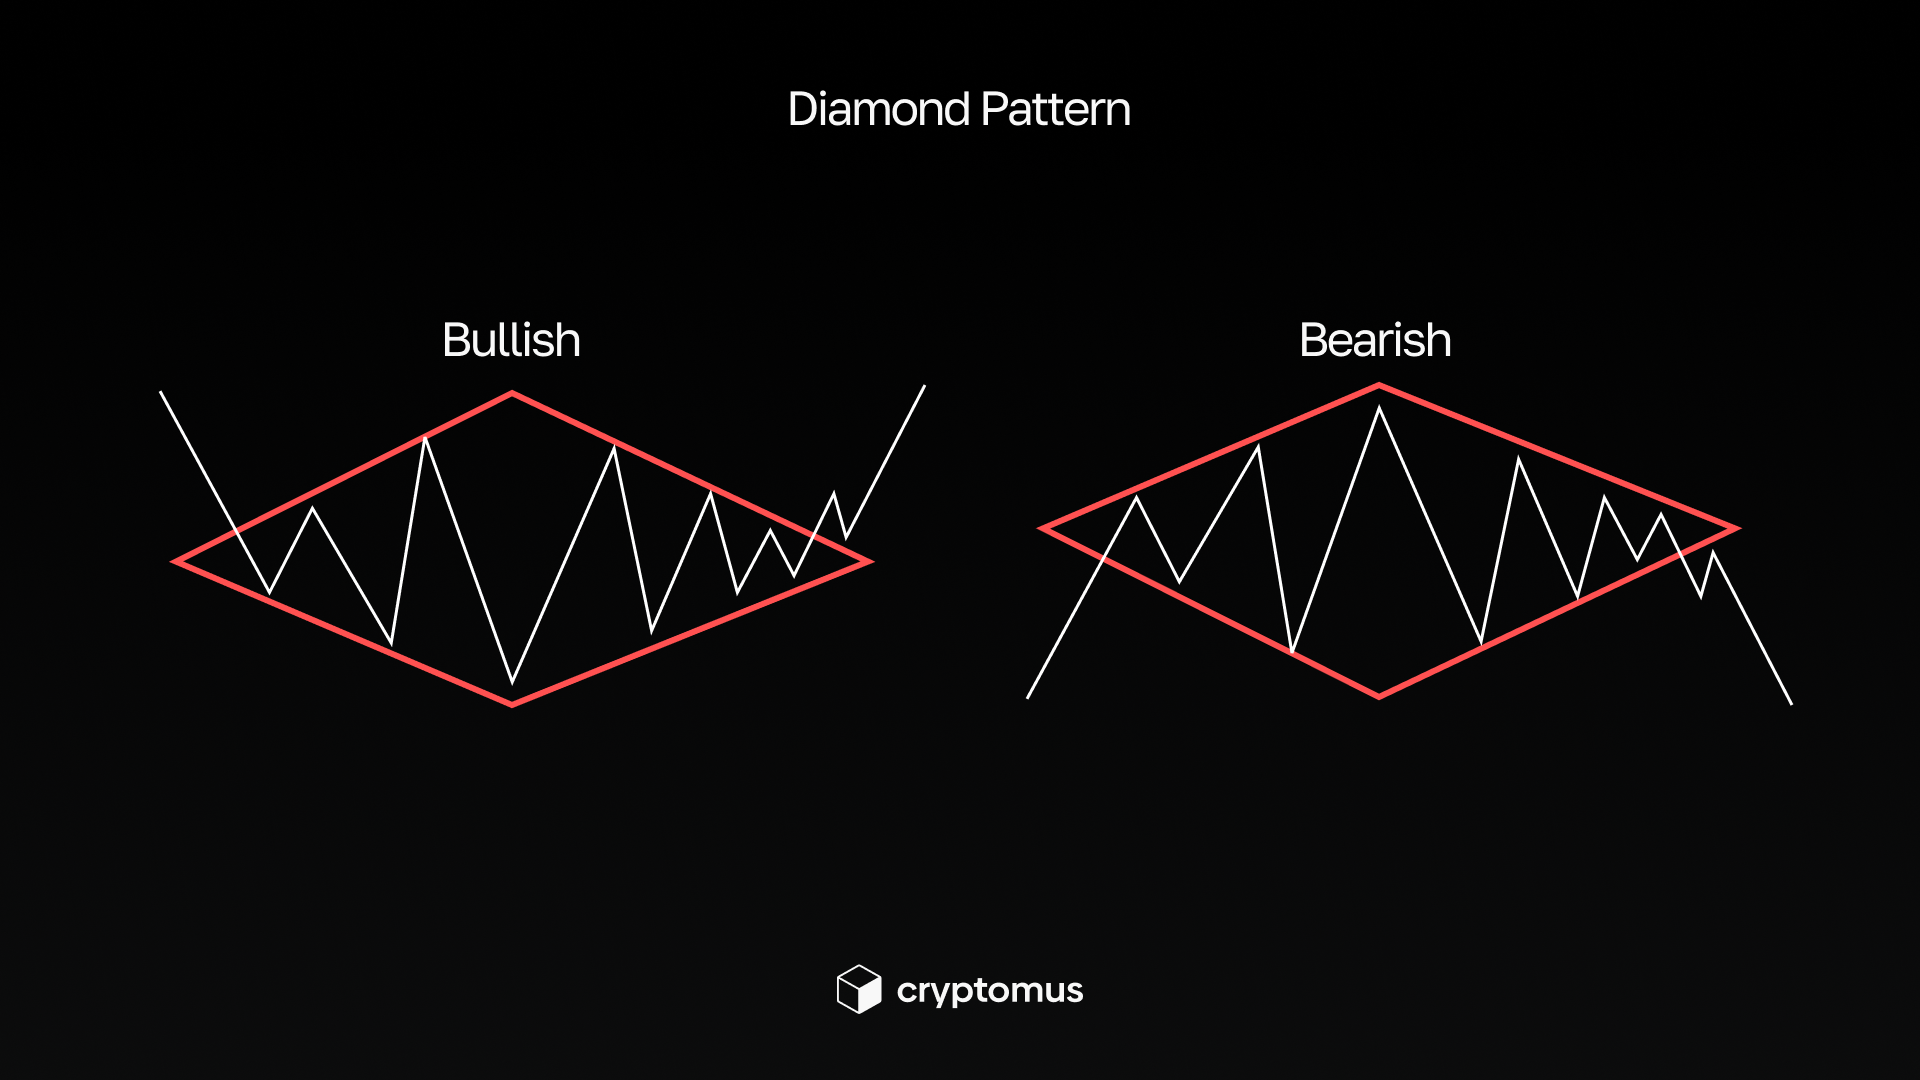
ダイヤモンドパターンは、拡大する高値・安値の連続のあとに収縮が続き、結果として菱形(ダイヤモンド)の形状を描く、比較的まれなトレンド転換のチャート形状です。強気にも弱気にも現れます。強気のダイヤモンドは下落トレンドの末期に出現し上昇の可能性を示唆し、弱気のダイヤモンドは上昇トレンドの天井付近で現れて下落の可能性を警告します。
弱気のダイヤモンドパターン
弱気版のダイヤモンドは上昇トレンドの天井圏で形成され、買い圧力の徐々な枯渇を示します。はじめに価格はより高い高値とより低い安値を作り、市場は「拡大」してボラティリティと攻防が強まります。続いて構造は「収縮」に移行し、高値は切り下がり、安値は切り上がっていきます。これはモメンタムの減衰と反転準備を示唆します。ダイヤモンドの下辺を明確に割り込むブレイクは、下落トレンドへの移行確率を高めます。
パターンの信頼性を高めるには、ブレイク時の出来高増加、上位足での弱さ、構造内の弱気ローソク足パターンといった確認が必要です。弱気のダイヤモンドは急落につながることが多く、トレーダーは自信のある下方ブレイク直後にショートポジションで入る機会として用います。
強気のダイヤモンドパターン
強気版のダイヤモンドは下落トレンドの底値圏で形成され、上方への反転を示唆します。初期には価格が拡大(より低い安値とより高い高値)し、ボラティリティの上昇と主導権争いが表れます。続いて構造は収縮段階に入り、高値は切り下がり、安値は切り上がります。これは売り方の勢い低下と市場の安定化を意味します。カギとなるのは上辺のブレイクアウトで、これが新たな上昇モメンタムへの移行を示す主たる強気シグナルです。
強気のダイヤモンドでも、ブレイク時の出来高増加、強気ローソク足パターン、上位足からの後押しといった確認が加わると信頼性は高まります。多くの場合、力強い上方ブレイク後に価格は大きく上昇し、ロングエントリーに適したパターンとなります。
このパターンの識別方法
ダイヤモンドは、価格の特徴的な「拡大→収縮」の並びで識別できます。はじめに、より高い高値とより低い安値が作られ、チャートは文字どおり左右に「広がり」ます。つづいて収縮段階に移行し、高値は切り下がり、安値は切り上がり、レンジは徐々に狭まりダイヤモンド形が形成されます。厳密に特定するには、極値をトレンドラインで結んで交差するチャネル(拡大型と収縮型)を描きます。強いトレンドの後に出現し、最終的にいずれかの辺をブレイクして完結する(強気なら上方、弱気なら下方)ことが確認材料となります。下図参照。

ダイヤモンドパターンのトレード活用法
ダイヤモンドは、価格変動から利益獲得の機会を示すサインとして用いられます。実戦での主要な活用方法は次のとおりです。
-
エントリー時機の見極め
価格がダイヤ内にある間は時期尚早で、構造は不確実性を映すに過ぎません。強いローソク足が上辺(強気)または下辺(弱気)を終値で明確に抜けた後に入ります。ブレイクこそが真のシグナルです。 -
シグナルの確認
ダイヤはダマシのブレイクも多いため、ブレイクの質を検証する必要があります。出来高の増加、上位足トレンドとの整合、反転足、RSIやMACDなどの指標による裏づけがあればより強力です。 -
ストップロスの設定
ブレイク足のクローズ後、方向が明確になってから設定します。強気ブレイクでは反対側の辺の下、またはパターン内部の直近スイング安値の少し下。弱気ブレイクでは反対側の辺の上、または直近スイング高値の少し上に置きます。 -
目標値の算出
期待できる値幅は「高さの法則」で計算します。ダイヤ内の最高値と最安値の垂直距離を測り、その距離をブレイク地点から投影して一次ターゲットとします。 -
境界線のリテスト待ち
保守的な戦略では、ブレイク後に境界のリテストを待つことで、より良いエントリーとタイトなストップが狙えます。
簡単に暗号資産取引を始めましょう 高い流動性、直感的なインターフェース、そして高度な取引ツールを備えたCryptomusで最初の注文を行いましょう。
ダイヤモンドパターンの長所・短所
パターン理解を深めるため、最重要ポイントを表にまとめました。
| 側面 | 特徴 | |
|---|---|---|
| メリット | 1. ブレイクアウト後の大きなトレンド変動を捉えやすくなります。 2. 構造の幾何学的な形が明確なため、トレーダーが視覚的に認識しやすいです。 3. 汎用的な分析ツールであり、さまざまな市場や時間足で機能します。 4. パターンの高さに基づいて、目標値を正確に算出し、明確なターゲットプランを立てることができます。 5. 出来高や上位時間足と組み合わせやすく、シグナルの信頼性を高めます。 | |
| デメリット | 1. 出現頻度が比較的低いため、継続的に実践へ活用するのが難しいです。 2. 一貫してマーキングするのが難しく、トレーダーによってダイヤモンドパターンの描き方が異なるため、シグナルが不明確になりやすいです。 3. だましのブレイクアウトを伴うことが多く、特に出来高が低い場面で起こりやすいです。 4. 市場のボラティリティや外部要因により、常に目標の高さまで到達するとは限りません。 5. レンジ相場や不規則な相場ではうまく機能せず、構造が簡単に崩れやすいです。 |
これまでにダイヤモンドパターンを見たことはありますか?実際に使ってみた結果はどうでしたか?ぜひコメントで共有してください!


暗号通貨の旅をシンプルに
暗号通貨を保管、送信、受け入れ、ステーキング、または取引したいですか? Cryptomusを使用すれば、すべてが可能です。便利なツールを使って、暗号通貨ファンドを登録して管理できます。
始めましょう