

David McMillan
Crypto-enthusiast who explores all the possibilities the blockchain technology suggests
What Is Fibonacci Retracement In Crypto And How To Use It
Table of Contents
Crypto trading is not just about analysis; it's also about predicting where the market is headed. This is where Fibonacci retracement comes in — a tool that identifies hidden support and resistance levels, turning them into key trading points. Sounds interesting? Discover in our new article how to use Fibonacci retracement correctly to improve your decision-making accuracy and boost your profits.
What Is Fibonacci Retracement?
Fibonacci retracement is a popular indicator in technical analysis that helps traders identify potential reversal points in an asset's price. Derived from the Fibonacci sequence, the tool uses key levels to predict where price corrections might occur during an ongoing trend.
These levels are considered significant because they often act as areas where the price may pause, reverse, or consolidate before continuing in the original direction. By applying Fibonacci retracement levels to a price chart, traders can identify possible support and resistance zones, helping them make more informed trading decisions.

Fibonacci Levels
The main Fibonacci levels used in crypto trading are 23.6%, 38.2%, 50%, 61.8%, and 78.6%. These levels represent the percentage of a price movement that may be retraced before the trend continues.
Here's a breakdown of each level:
-
23.6%: A shallow retracement, often indicating a minor price pullback before the trend resumes.
-
38.2%: A deeper retracement, where the price could pause or reverse before continuing its original direction.
-
50%: Though not technically part of the Fibonacci sequence, the 50% level is widely used because it represents the midpoint of the price movement, often showing a strong psychological level.
-
61.8%: Known as the "golden ratio", this level is one of the most important Fibonacci levels, frequently acting as strong support or resistance.
-
78.6%: A deep retracement level, which suggests a significant correction, potentially signaling a reversal or continuation of the trend.
Traders use these levels to gauge where the price might correct before continuing its original trend.
How Does Fibonacci Retracement Work?
Fibonacci retracement works by identifying the key points of a price movement — the swing high and swing low. Once these points are defined, Fibonacci retracement levels are plotted between them to highlight potential areas where the price might pull back before continuing its trend. To calculate these levels, traders measure the vertical distance between the swing high and swing low, then apply the Fibonacci percentages to predict the retracement levels.
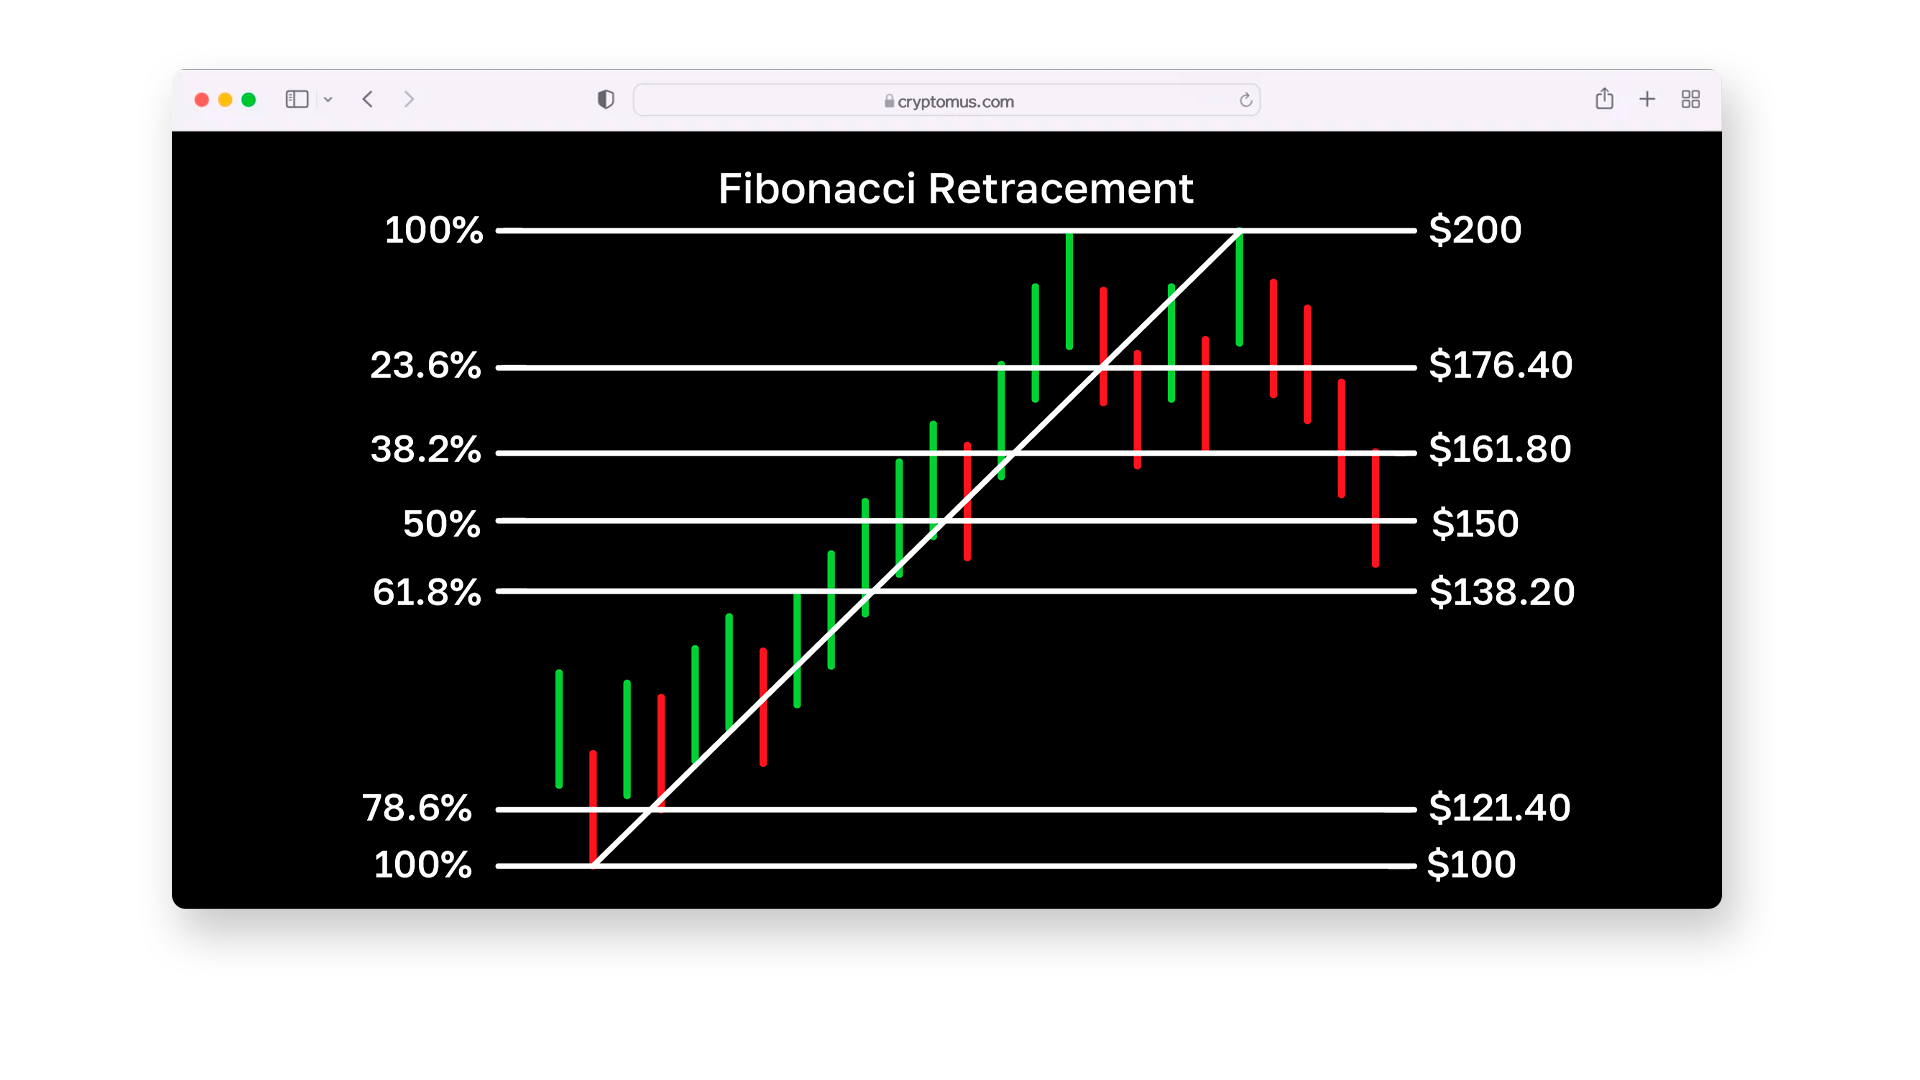
For example, if a crypto’s price rises from $100 to $200, the Fibonacci levels will be calculated as follows:
-
23.6% level: $200 - (100 * 0.236) = $176.40
-
38.2% level: $200 - (100 * 0.382) = $161.80
-
50% level: $200 - (100 * 0.50) = $150
-
61.8% level: $200 - (100 * 0.618) = $138.20
-
78.6% level: $200 - (100 * 0.786) = $121.40
These levels are then plotted on the price chart, and traders watch them closely for any signs of reversal or trend continuation at those points.
How To Read Fibonacci Charts?
Reading Fibonacci charts involves interpreting how the price reacts to the plotted Fibonacci retracement levels. Further's how to approach it.
Watch For Price Behavior At Fibonacci Levels
When the price reaches one of the Fibonacci levels, observe how it behaves:
-
Price bounce: if the price bounces off a level and continues in the same direction, the trend may resume.
-
Price consolidation: if the price consolidates (moves sideways), it may indicate a pause before the trend continues.
-
Breakthrough: if the price breaks through a level, it could signal a trend reversal or a deeper correction.
For example, if the price retraces to the 38.2% level and starts to bounce, this could suggest the trend will continue. On the other hand, if it breaks the 61.8% level, it might indicate a reversal.
Confirm With Other Indicators
To confirm the price behavior at Fibonacci levels, use other technical indicators:
-
Candlestick patterns: look for reversal patterns near Fibonacci levels.
-
Moving averages: they can help identify the overall trend.
-
Volume: higher volume at Fibonacci levels can suggest stronger support or resistance.
By observing price movements and confirming with other tools, you can make more informed decisions on entry or exit points.
Bitcoin & Fibonacci
Fibonacci retracement levels are widely used in Bitcoin trading to identify potential areas of support and resistance. Since BTC is highly volatile, these levels can provide valuable insights for predicting price. For instance, if Bitcoin’s price rises from $90,000 to $100,000, key Fibonacci levels such as 23.6%, 38.2%, and 50% can be plotted to predict possible price retracements. The key levels would be:
-
23.6% level: $96,760
-
38.2% level: $94,180
-
50% level: $90,000
-
61.8% level: $85,820
These levels indicate potential areas where the price might pull back before continuing its original trend. Traders closely monitor how Bitcoin reacts at these points to determine whether the trend will continue or if a reversal is likely. A bounce at these levels could signal a continuation of the uptrend, while a break below key levels like 50% or 61.8% might suggest a deeper correction or trend reversal.
In conclusion, Fibonacci retracement is a valuable tool for cryptocurrency traders. They can gain insights into where prices might retrace or reverse, helping them make informed decisions. While Fibonacci retracement is not foolproof, when combined with other technical indicators, it can significantly enhance a trader's ability to navigate the volatile crypto market and increase the likelihood of making profitable trades. Thank you for reading!


Simplify Your Crypto Journey
Want to store, send, accept, stake, or trade cryptocurrencies? With Cryptomus it's all possible — sign up and manage your cryptocurrency funds with our handy tools.
Get Started