
David McMillan
Crypto-enthusiast who explores all the possibilities the blockchain technology suggests
What Are Triangle Patterns And How To Use Them In Trading?
Table of Contents
Financial tools help tremendously when trading cryptocurrencies; with the right strategy, you can quickly spot a gold mine of return with just one glance. Today we will tell you about one of such tools, triangle patterns. You will learn how important the direction of the angle and the shape of the formation are. Spoiler: you won’t need a protractor since we are talking about charts.

What Are Triangle Patterns?
A triangle pattern is a technical analysis figure that predicts a potential price breakout in crypto. It forms when trend lines narrow along a converging price range. Thus, the graph becomes triangular in shape, hence its name.
The triangle pattern signals a pause in the current trend or reversal. The chart consists of an upper and lower trend line. We can see a signal as soon as the price goes outside the pattern.
There are three possible types of this pattern. We talk about them in more detail further.
Types Of Triangle Patterns
As mentioned earlier, triangle patterns appear in three different variations, which are ascending, descending, and symmetrical. Let's talk more about each of them.
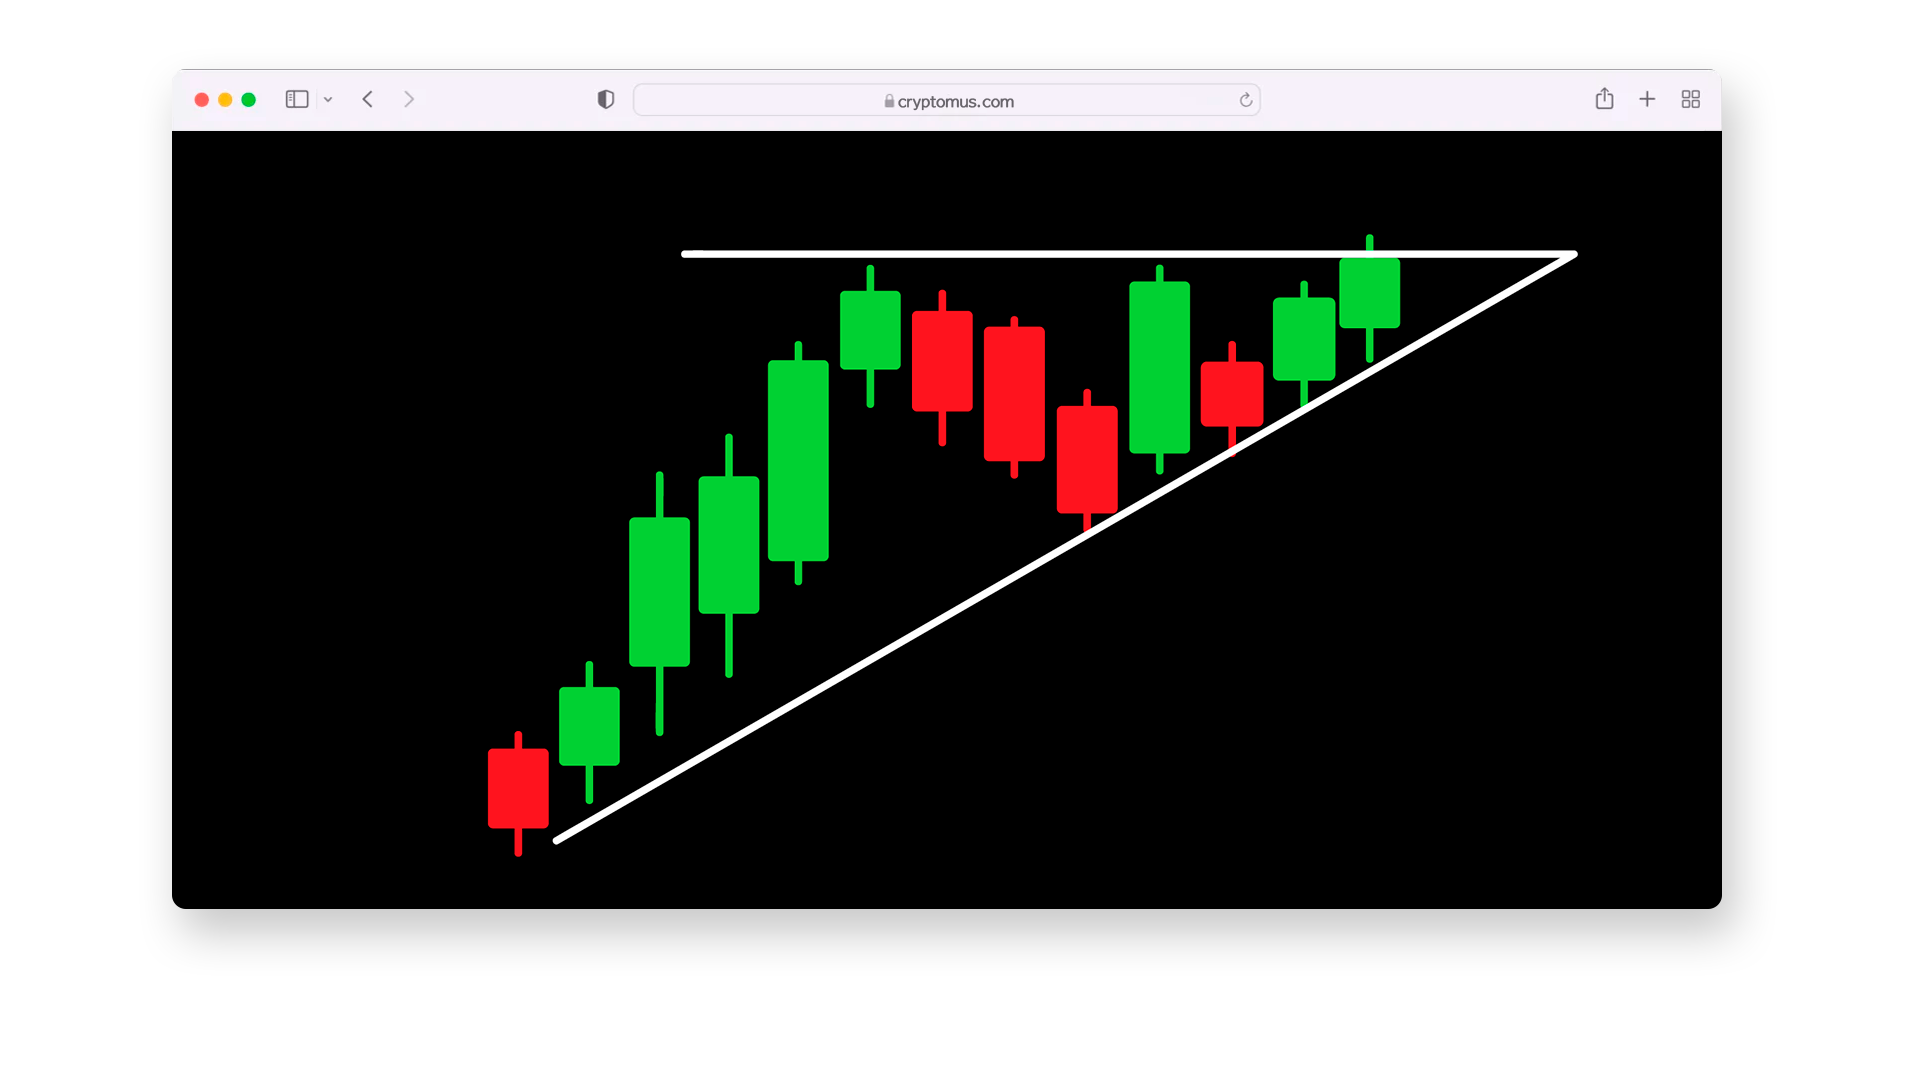
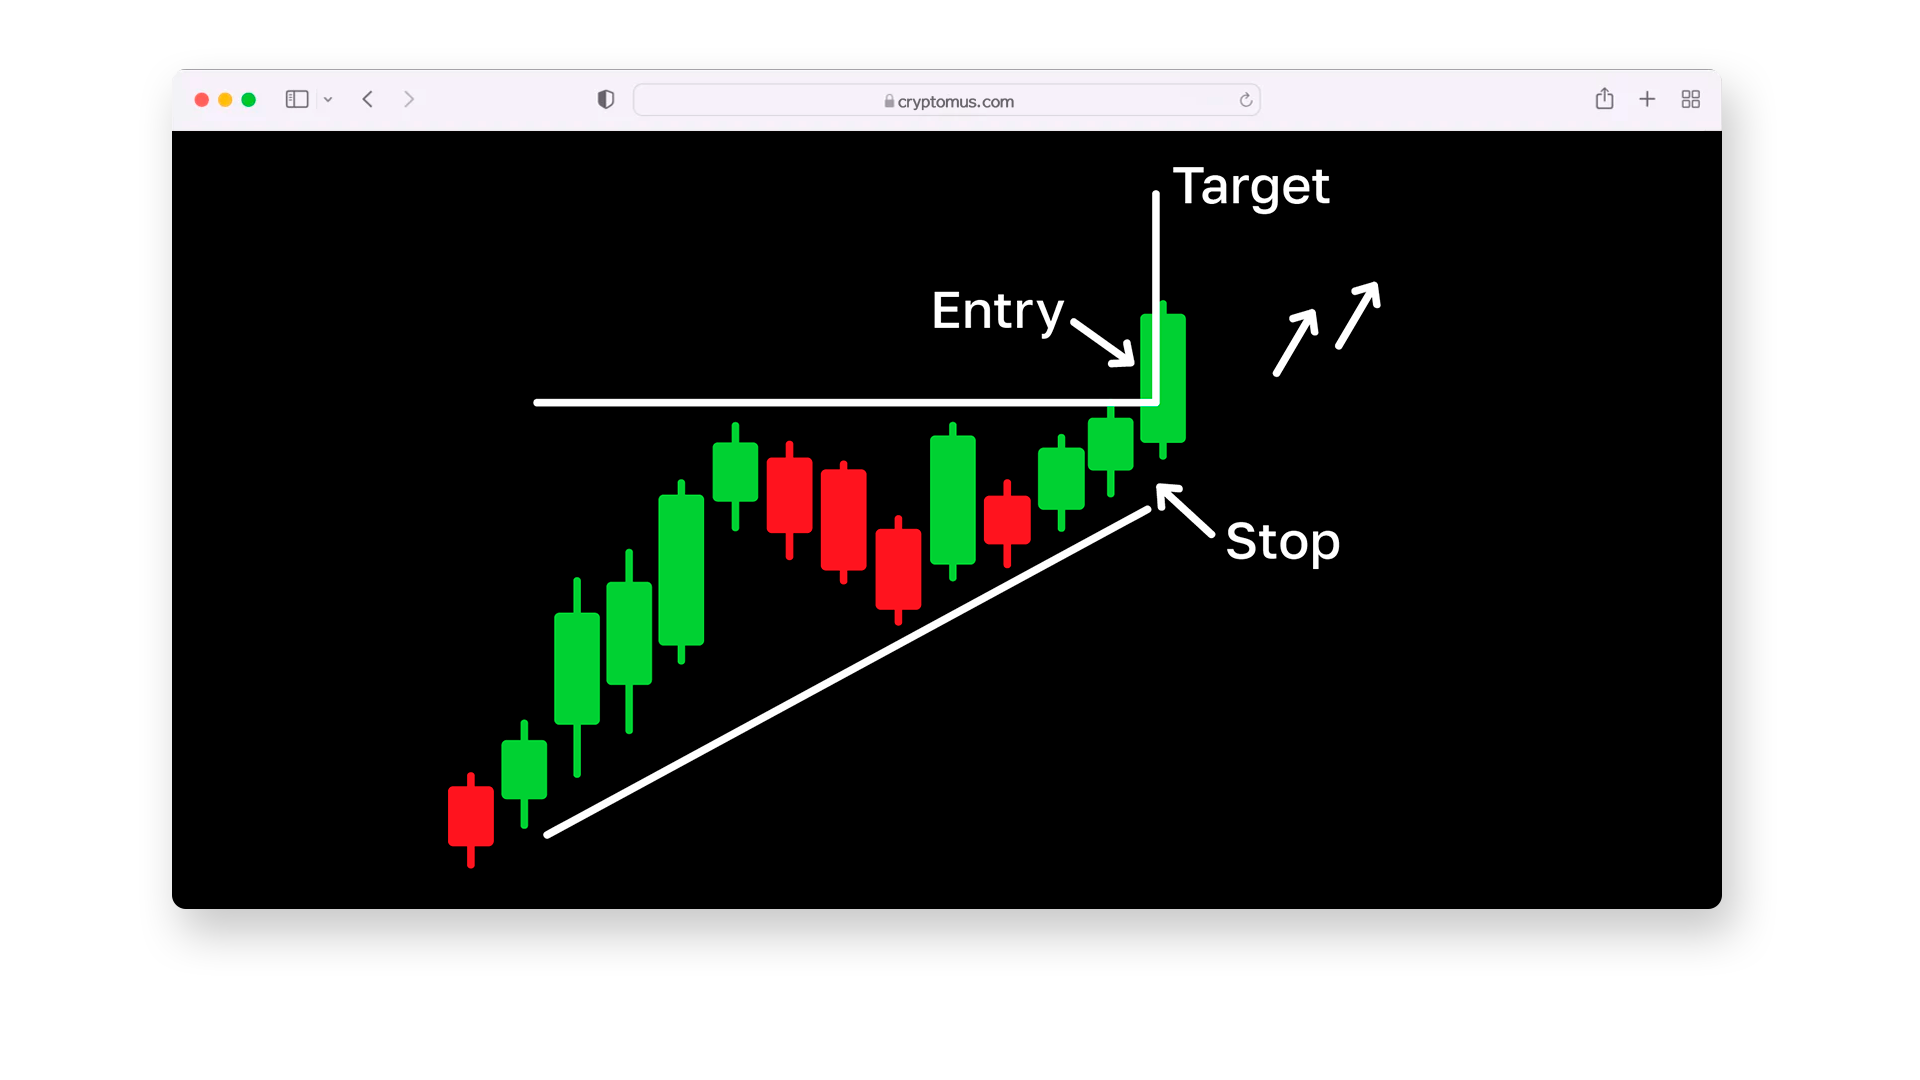
Ascending Triangle
The ascending triangle is a bullish continuation pattern that signals a possible upward breakout in crypto trading. It forms with lower and horizontal upper trendlines. At this time, the price breaks out of the triangle and moves in the uptrend direction. As a result, the market compresses, creating pressure on the resistance level.
To trade with this tactic, it is important to wait until resistance is broken and see an increase in volume. In this phase, a rising lower trendline indicates that the price is moving upwards. Entering a trade is possible after the retest of the broken level, which now becomes support. Stop loss is placed slightly below this line or under the last low.
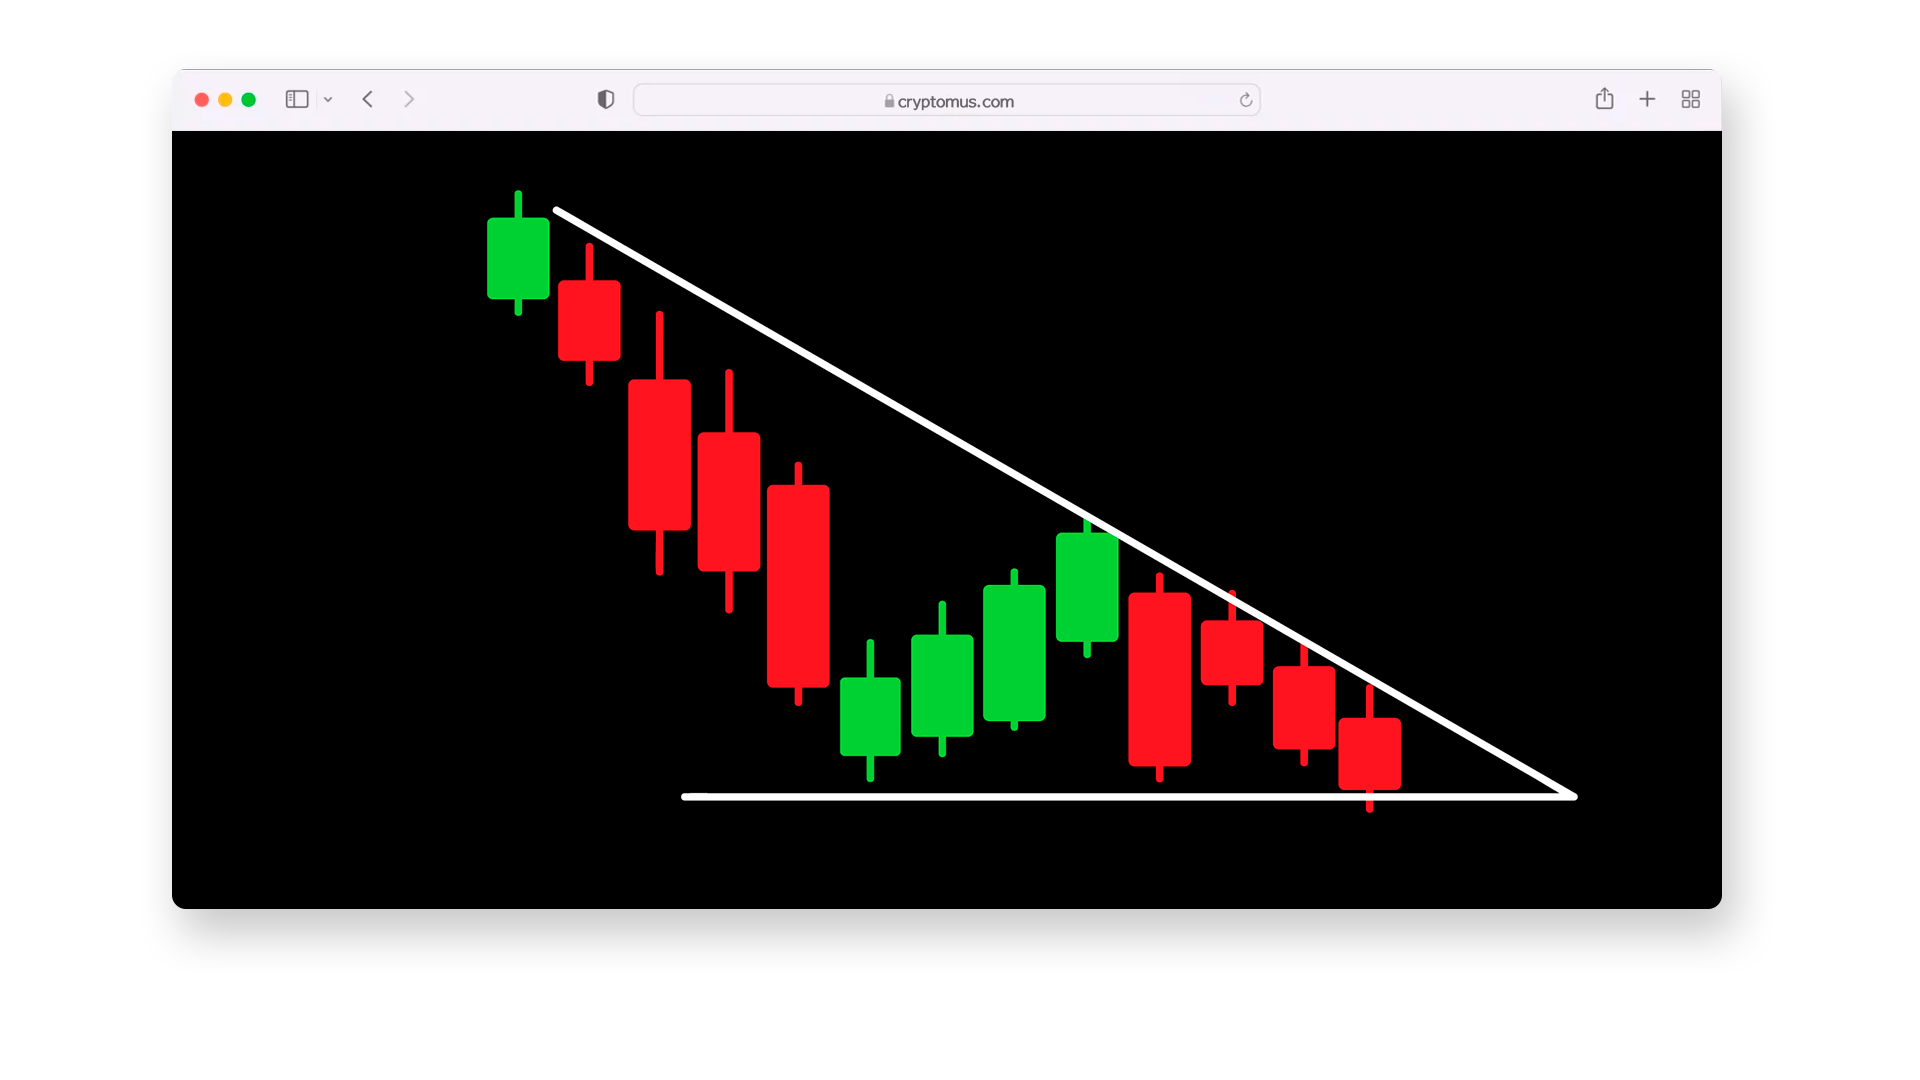
Descending Triangle
The descending triangle is a bearish continuation pattern that indicates a potential breakout to the downside in crypto. It forms from an upper trend line and a horizontal lower trend line, and usually acts as support.
The signal forms when the price breaks the horizontal line and continues to move in the trend direction. This means that sellers are getting stronger and buyers are unable to push the price higher. To trade this pattern, it is important to wait for a breakdown of the support level and make sure that it is accompanied by an increase in volumes.
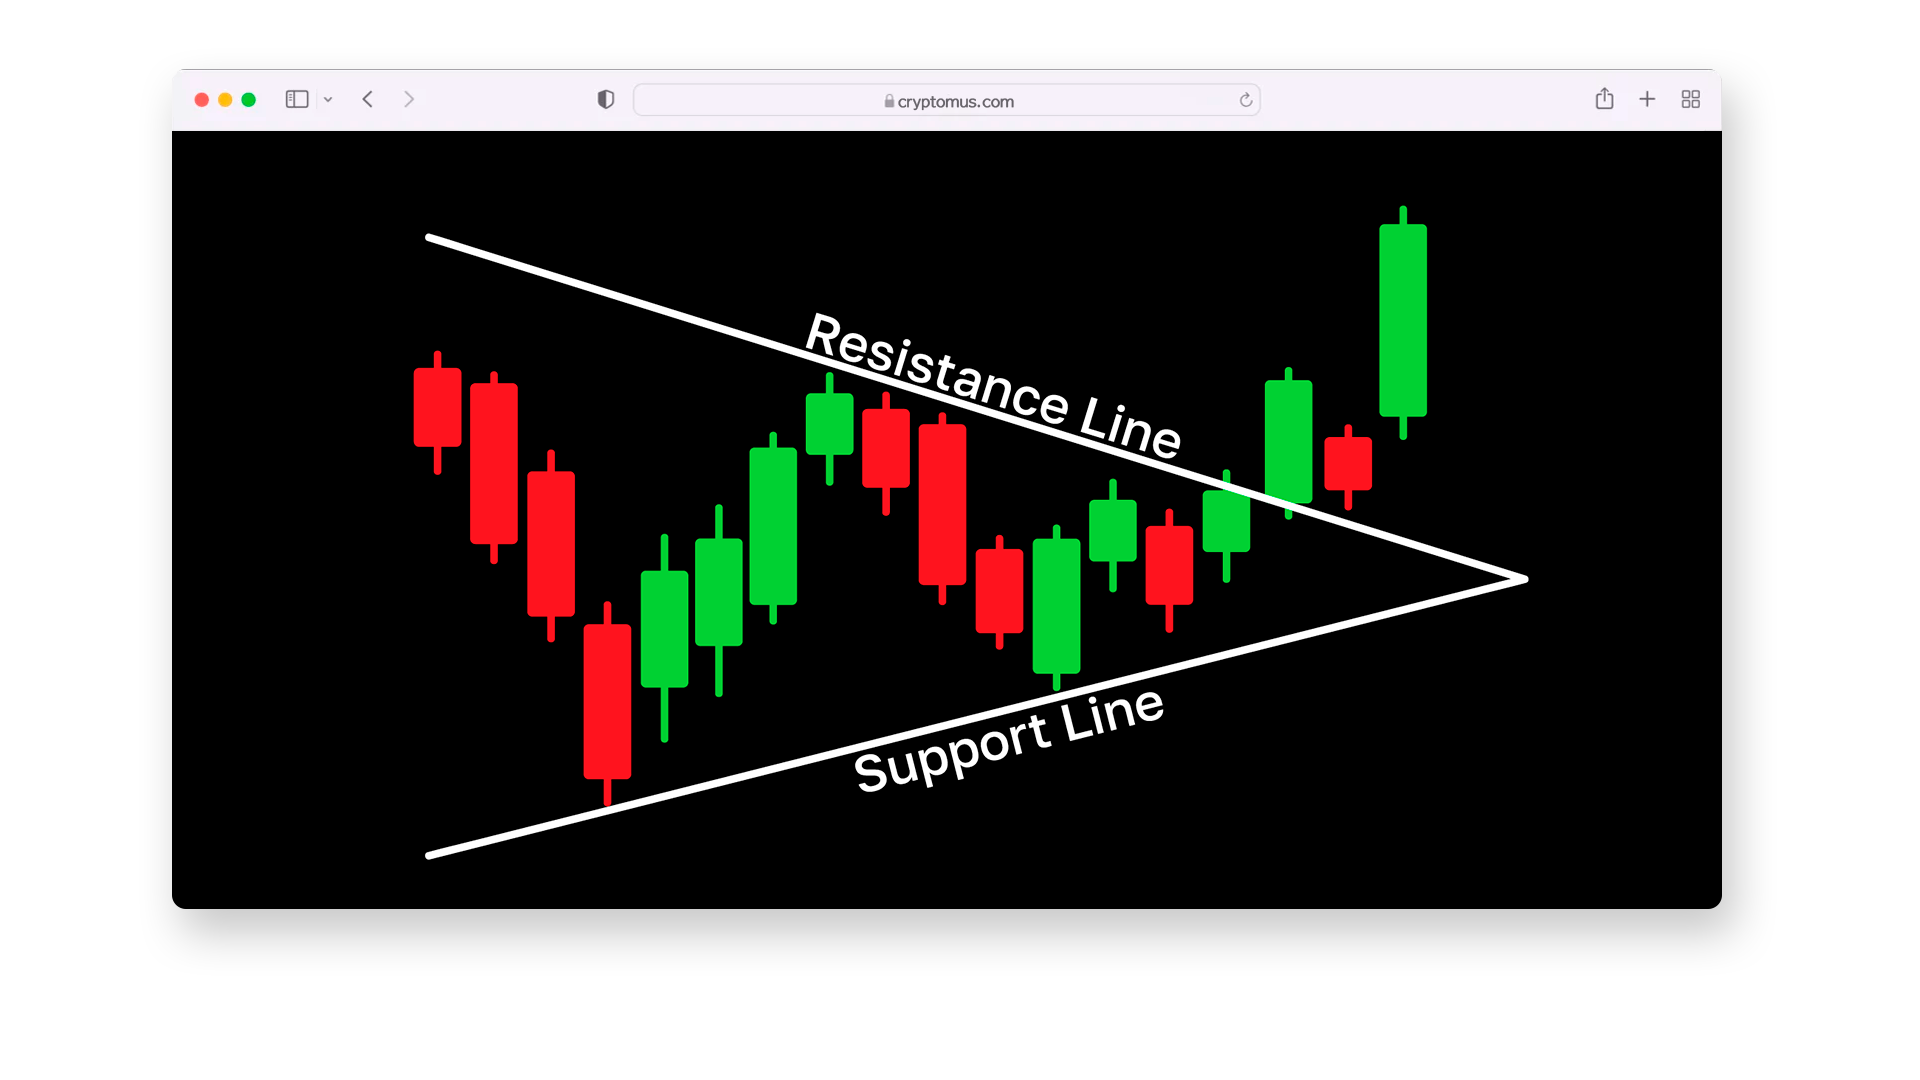
Symmetrical Triangle
The symmetrical triangle is a neutral pattern in crypto that forms during price consolidation and trend lines moving towards each other. The narrower they are, the higher the likelihood of a breakout. Unlike an ascending or descending triangle, there is no clear dominance of buyers or sellers in this case.
The price consolidates within the range, and traders will trade in whichever direction the breakout occurs. The upper resistance line slopes downward while the lower support line slopes upward, creating an equilibrium of forces.
This pattern signals the accumulation of positions before a strong move, but the direction of the breakout is not predetermined. If the price goes up outside the triangle, it is a signal to long position. If it breaks downwards, it signals a short. The breakout is usually accompanied by an increase in volume, which confirms the strength of the move.
How To Identify Triangle Patterns?
To identify a Triangle pattern in the market, follow the algorithm below:
-
Look for a narrowing range: the price moves within two converging trendlines (resistance and support) and forms a triangle.
-
Find the lows and highs: in an ascending triangle, the lows are gradually rising; in a descending, the highs are declining. In a symmetrical triangle, both of these processes occur simultaneously.
-
Pay attention to the lack of a clear breakout: the pattern forms during a consolidation phase. The market struggles to break through the support and resistance levels. In turn, the price tests these levels several times but does not go beyond them.
-
Expect a decrease in volume: while the formation of a triangle, trading volumes are gradually decreasing. This indicates a decline in market activity in general.
-
Confirm the breakout: when the price goes beyond the triangle (breakout of the support or resistance level), volumes increase sharply. This confirms that the market is ready for a strong move.
This process will help you accurately identify strategies on the chart and use them to make decisions at the right time.
How To Use Triangles In Trading?
Now that you know about all types of triangles and how to identify them, let's move on to the most interesting part of the article about trading. To help you maximize your profits and avoid mistakes, we have prepared a step-by-step guide:
-
Find the pattern on the chart: pay attention to the decrease in volume during the formation of the pattern; it usually occurs after a period of clearly defined directional price movement. When the price starts to narrow between two trend lines, it may indicate the formation of a triangle. If there is no movement, the figure may be false.
-
Draw the boundaries of the triangle for each type: be aware that with an ascending triangle, the upper boundary (resistance) should be horizontal, and the lower boundary (support) goes upwards. In the case of a descending triangle, the lower boundary will remain horizontal, and the upper boundary will go down. This constitutes a series of descending highs. Finally, in the case of the symmetrical triangle, both boundaries converge towards each other, one rising and the other falling.
-
Confirm the pattern: keep in mind that the price should touch the borders of each line at least 2-3 times. At this time there is a consolidation phase, where the amount of volume is decreasing and the market is contracting before the breakout.
-
Wait for the breakdown: watch the price; it should go beyond the triangle boundaries. Wait for a retest of the broken line and a sharp increase in volume; this will confirm signals.
-
Calculate the potential profit: remember, that the profit target will be the height of the triangle from the breakout point. The stop-loss placement depends on the market trend: set it above resistance in case of short positions; place it slightly below the support level for long. Congratulations, you are much closer to profit!
To make clear the way the Triangle pattern works, let's look at a specific example. If the asset forms an ascending triangle, the price touches the resistance level several times, for example, $50. At this time, the lows are rising, and we are waiting for an upside breakout. The target is $52, where our profit will be $2.
Triangle patterns are universal for any market sentiment, and they are also simple in their application. If you use the strategy correctly, your chances of making profits increase. You can always test the effectiveness of the patterns on the Cryptomus exchange. With a large selection of trading pairs, you will definitely find the most suitable one for your needs.
Have you ever used triangle patterns in practice? Write about it in the comments.


Simplify Your Crypto Journey
Want to store, send, accept, stake, or trade cryptocurrencies? With Cryptomus it's all possible — sign up and manage your cryptocurrency funds with our handy tools.
Get Started