

David McMillan
Crypto-enthusiast who explores all the possibilities the blockchain technology suggests
What Is A Double Top (“M”) Pattern And How To Use It In Trading?
Table of Contents
There are many indicators that can help in crypto trading to catch the right moment to open a position or make a purchase. In today's article, we will analyze the Double Top pattern with an unusual “M” designation. What does this letter mean, and how will the pattern enhance crypto tactics? Read all the details below to increase your chances of spotting profitable opportunities!
What Is A Double Top Pattern?
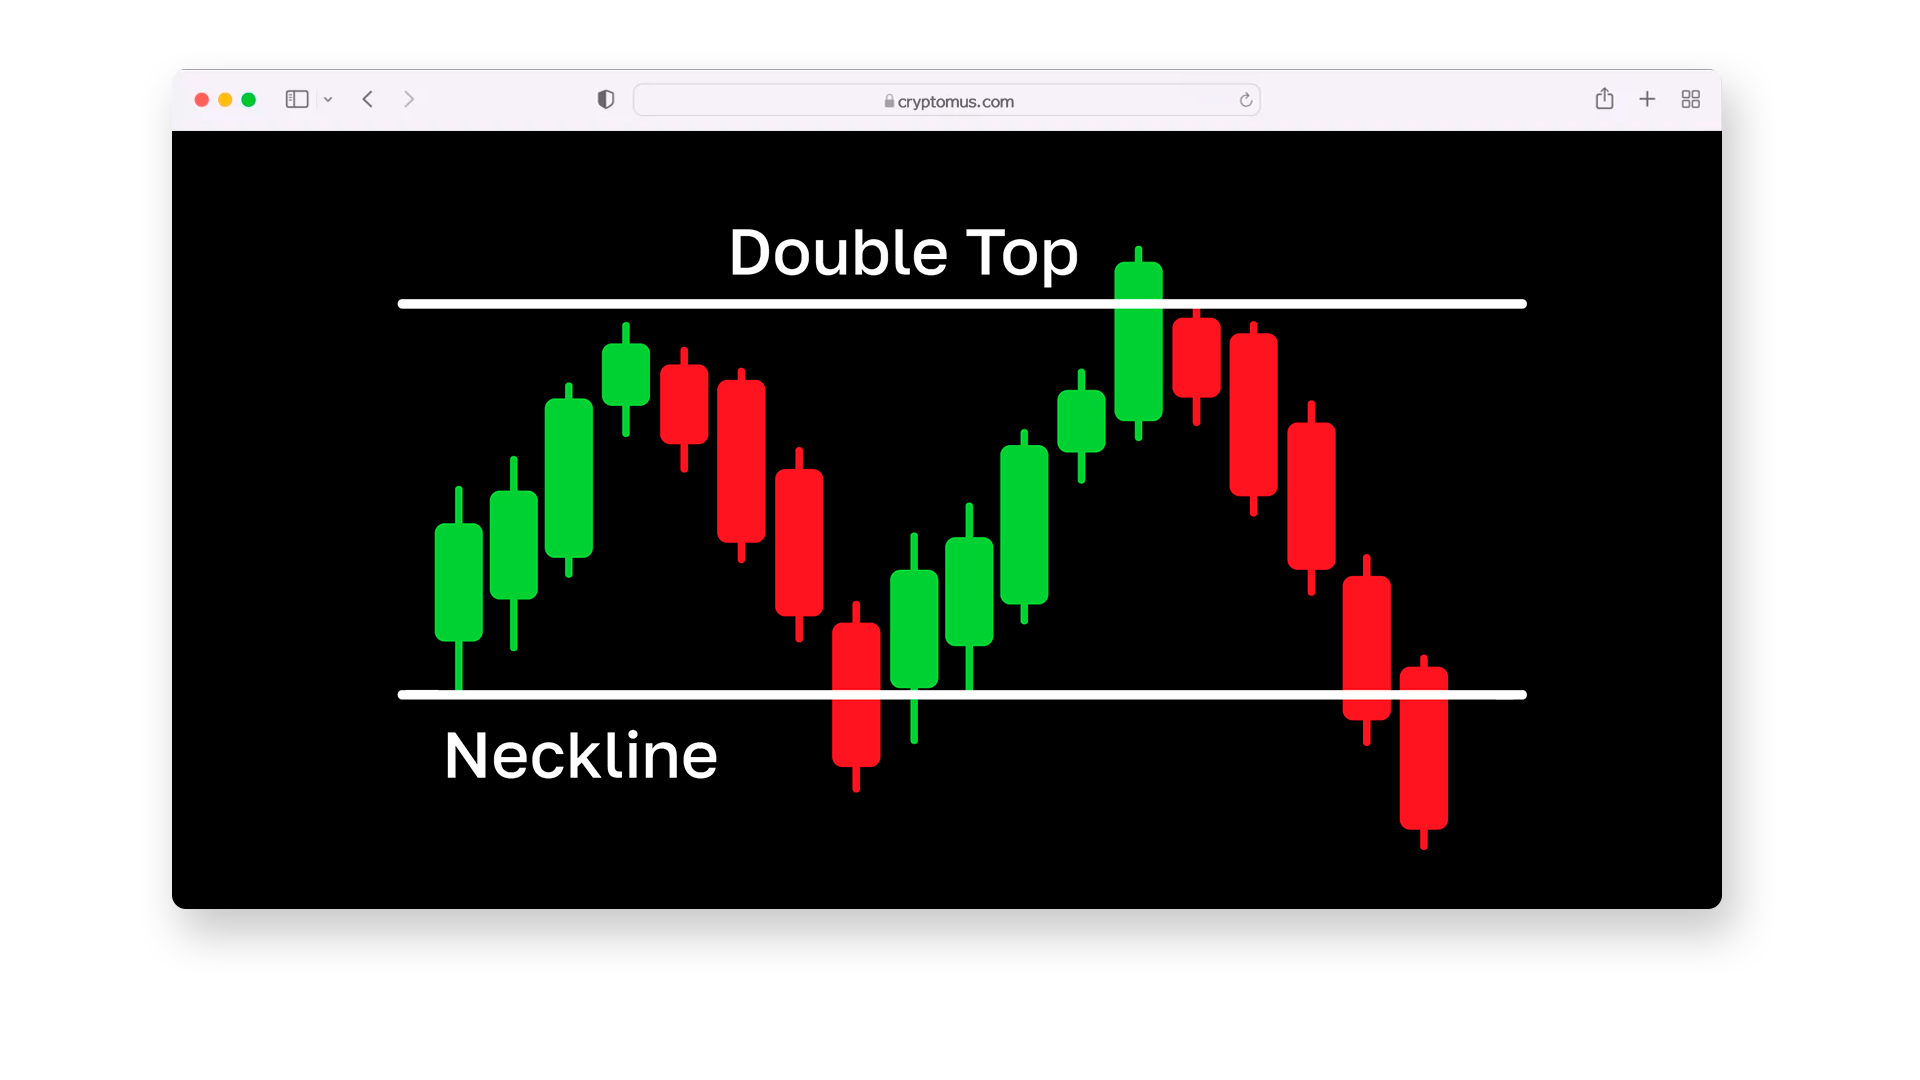
The Double Top pattern is a technical analysis tool that shows the reversal of an uptrend in crypto. It is easy to recognize on the chart; the price reaches roughly the same high twice but cannot overcome this resistance level. Then the price begins to decline, and at this point, it reaches two highs, which become like two mountains. As you can understand, this is where the name of the strategy and the “M” designation came from.
The Double Top pattern is most often considered a bearish signal and predicts a price decline. Usually after the second peak, the price of the asset comes back to its original position, so the price trend repeats. It is also distinctive that the second peak is slightly lower than the first one; this signals the loss of price momentum and the weakening of resistance.
How To Identify The “M” Pattern?
The Double Top pattern typically forms after a strong uptrend. However, opening trades is too early based on a potential Double Top formation as you could get caught in a false breakout. Follow the algorithm below to correctly identify the pattern in the market:
-
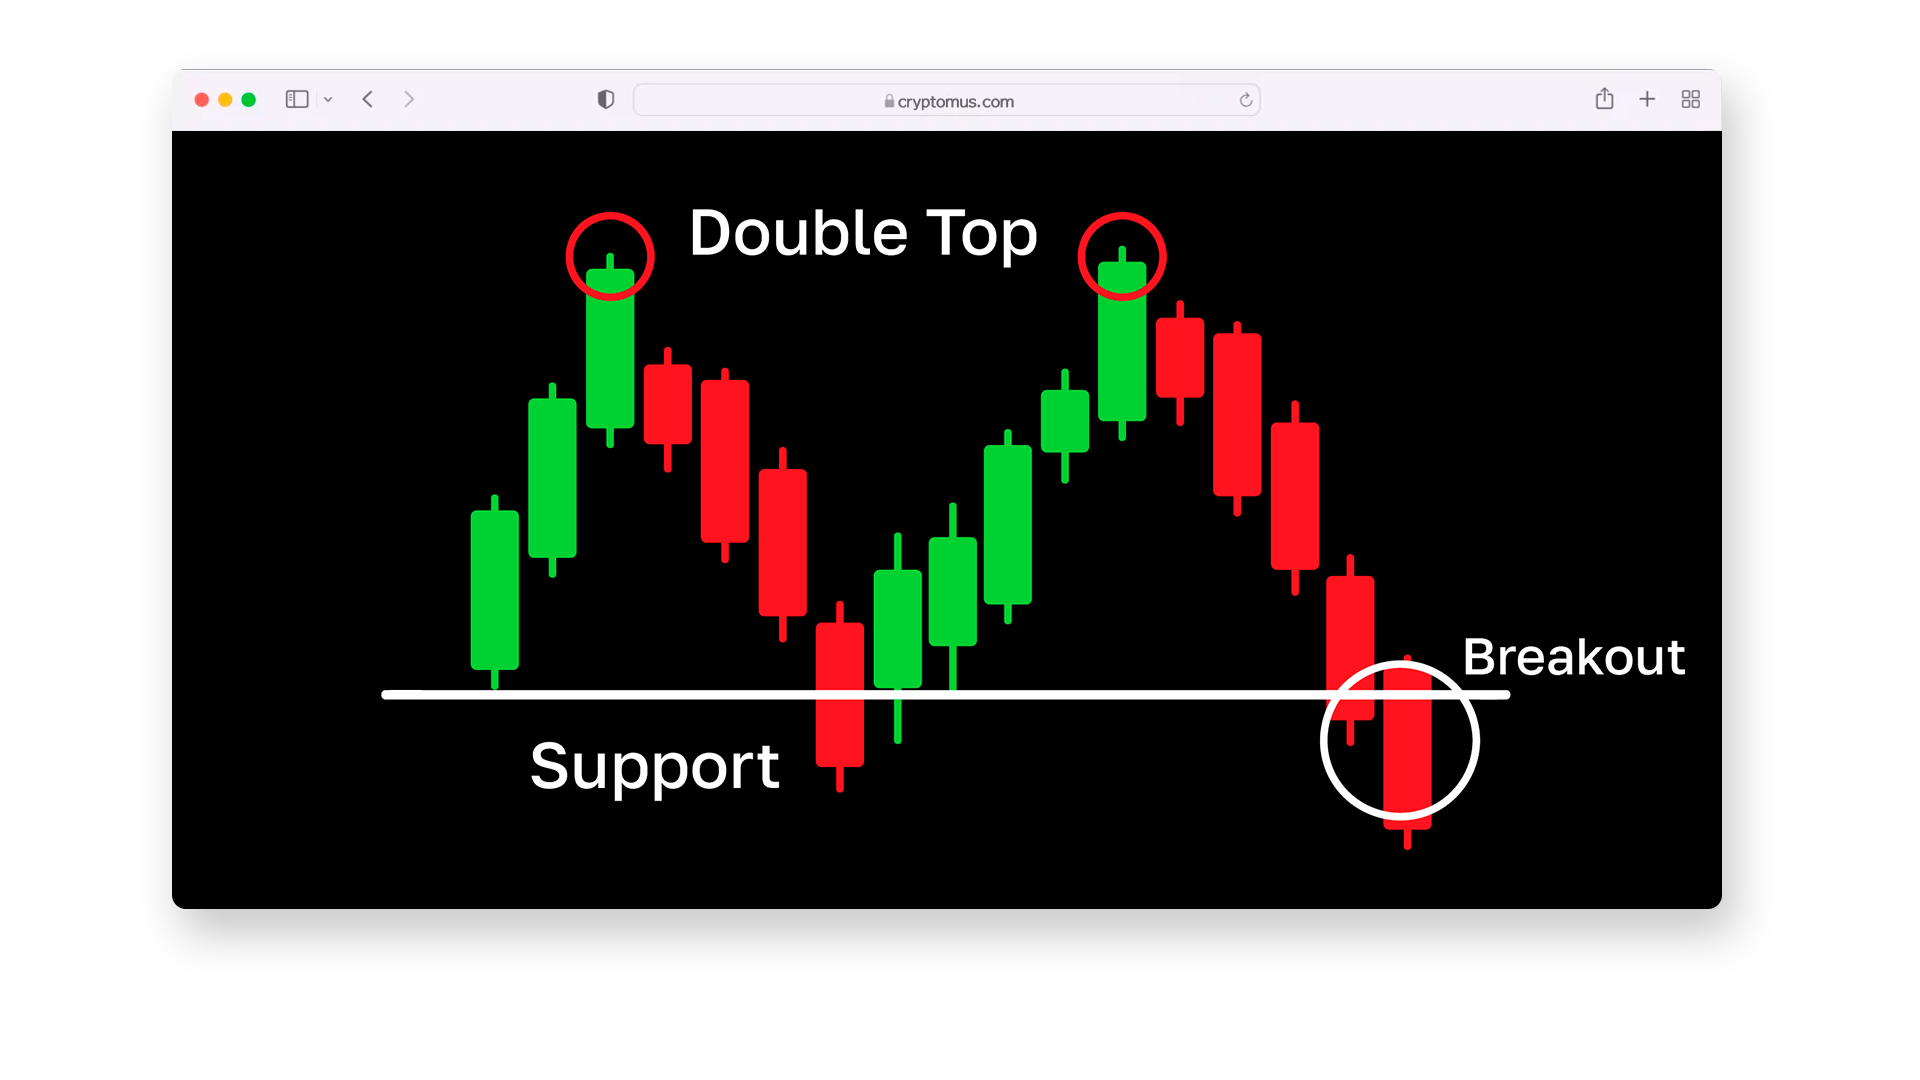
Find two peaks: price reaches approximately the same peak level twice.
-
Check the neckline: the line passes through the minimum between the two peaks; it acts as a key support level.
-
Confirm the breakout: if the price breaks the neckline downwards, this confirms the formation of a Double Top. At this time, trading volume often increases during the breakout phase, which reinforces the signal.
-
Target the price level: measure the distance from the neckline to the top of the highs and postpone it down from the breakout point. For example, if the price reaches $50 twice and the low between them is $45, that is where the neckline goes. If price breaks $45 downward, the pattern is considered confirmed. The expected fall could be $5 lower, that is, down to $40.
How To Use The Double Top Pattern In Trading?
Now that you know what a Double Top is and how to identify it, it is time to learn more about trading using it. To capitalize on Double Top, follow these steps:
-
Wait for the confirmation: follow the diagram until the moment the price breaks the neckline; this is often accompanied by an increase in volume.
-
Enter the trade: open a short position immediately after the breakout.
-
Set a stop loss: place stop loss above the last peak to minimize risks in case of a false breakout.
-
Manage risks: do not use all of your capital for one trade; limit your risk to 1-2% of your total deposit.
In addition to technical analysis, consider fundamental factors such as regulatory changes, technological advances, and market news that could influence cryptocurrency prices.

Pros And Cons Of A Double Top Pattern
Like any financial tool, Double Top has its advantages and disadvantages, and now we will tell you about them in the table:
| Aspect | Characteristics | |
|---|---|---|
| Pros | Clear resistance level. The pattern defines support and resistance zones, making it easier to identify entry and exit points. Trend direction determination. Double Top signals a potential reversal from a bullish to a bearish trend, providing an important sign for traders. Strong validation. Once the pattern is validated, it gives a reliable indication of price movement direction. | |
| Cons | False signals. The pattern may lead to an incorrect strategy due to a false breakout . Subjective identification of the pattern. It leads to different interpretations among traders because of inability to read charts. |
You can reduce the probability of errors by combining the Double Top pattern with other analysis tools, such as volume levels or indicators like RSI. To minimize subjective interpretation, use a clear identification algorithm and predefined criteria to recognize the pattern.

The Double Top pattern is an excellent financial tool that clearly signals a potential trend reversal from bullish to bearish. It allows traders to more accurately identify key entry and exit positions and get a good profit as a result. Stay tuned to the Cryptomus blog for more insights on essential crypto strategies!
Have you heard about Double Top before? Write about it in the comments.


Simplify Your Crypto Journey
Want to store, send, accept, stake, or trade cryptocurrencies? With Cryptomus it's all possible — sign up and manage your cryptocurrency funds with our handy tools.
Get Started