
Матвей Косимов
Крипто-энтузиаст, исследующий возможности блокчейн-технологий и цифровых финансов
Что такое паттерн «Голова и плечи» и как его использовать в торговле?
Оглавление
Графики — это отличный инструмент, помогающий трейдерам заметить правильный момент для открытия и закрытия позиций. Сегодня мы расскажем о таком инструменте, как паттерн «Голова и плечи». Вы узнаете, как его определить на графике, чем отличается его инвертированная версия и как использовать его для получения максимальной прибыли.
Что такое паттерн «Голова и плечи»?
Начнем с определения. Паттерн «Голова и плечи» — один из самых надежных паттернов технического анализа в криптотрейдинге, который трейдеры используют для предсказания разворота тренда. Он помогает определить, когда цены прекратят падение и начнут расти (или наоборот).
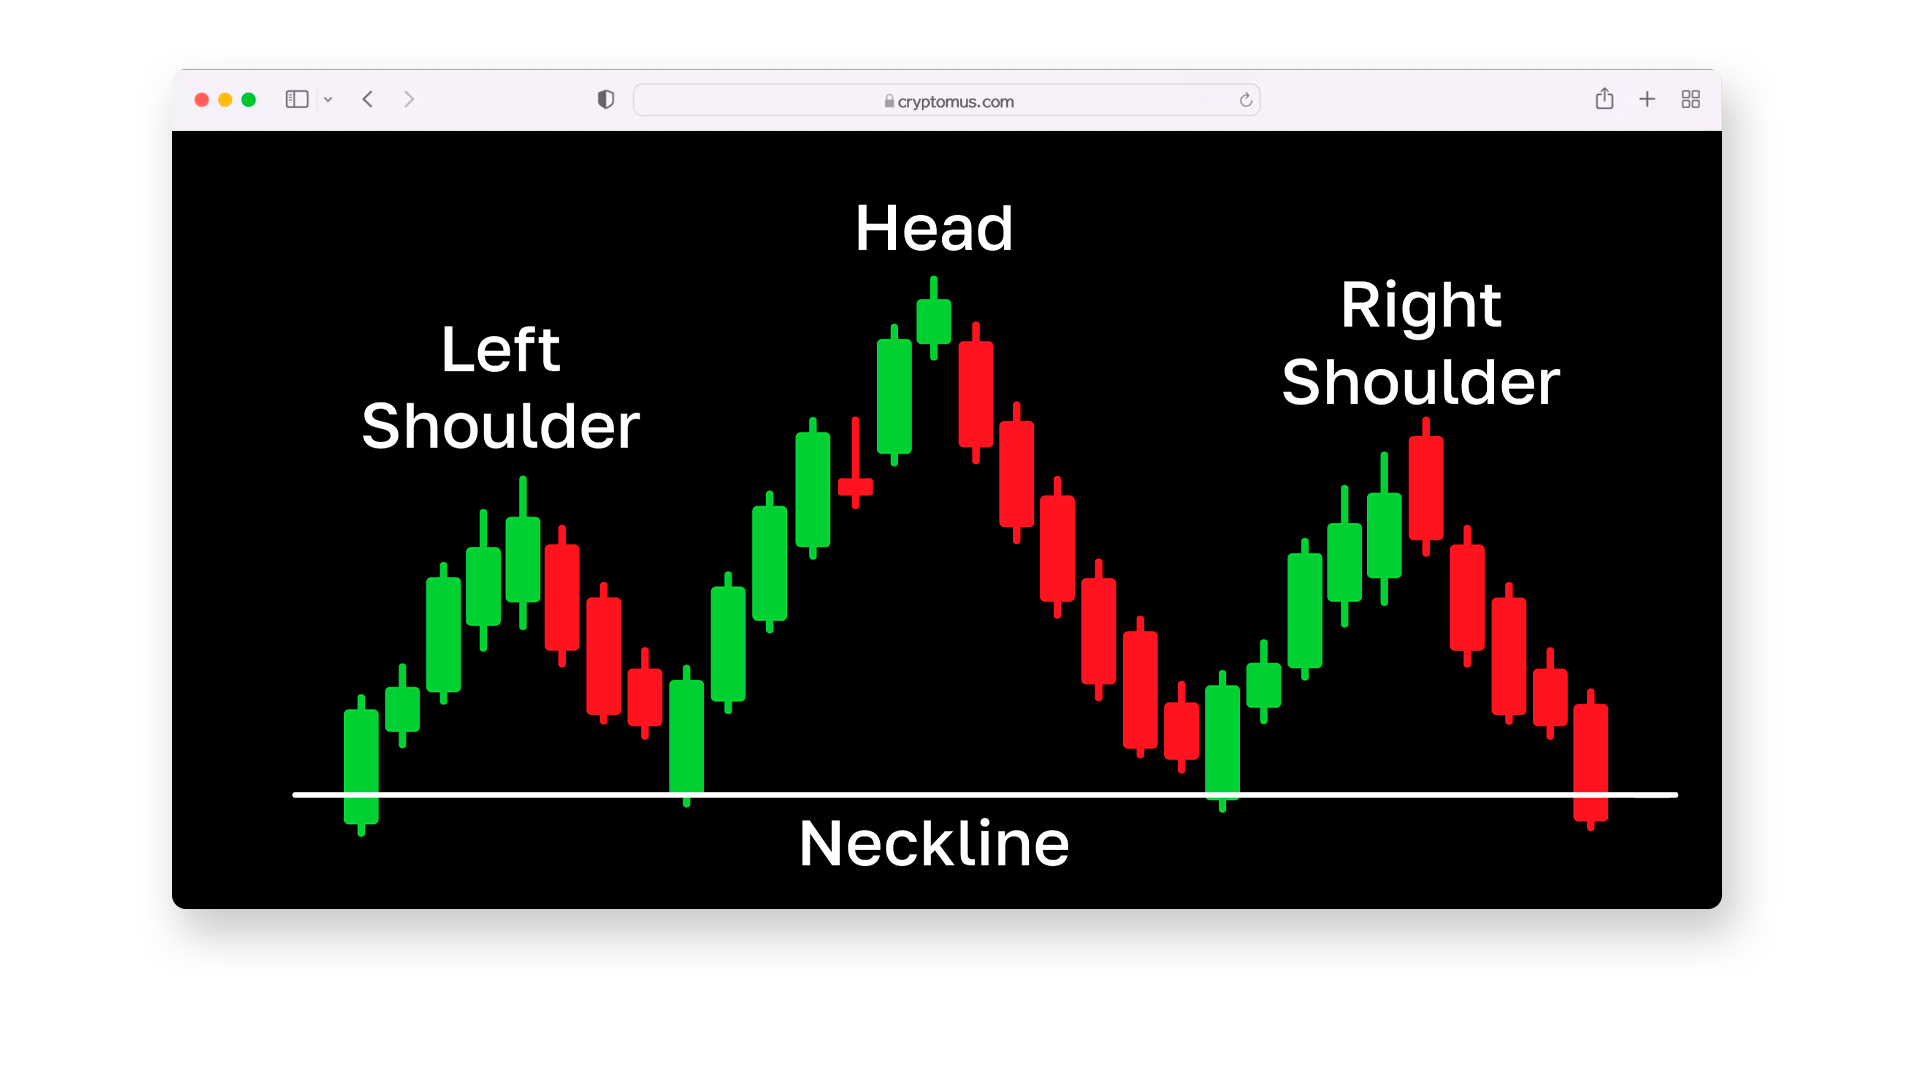
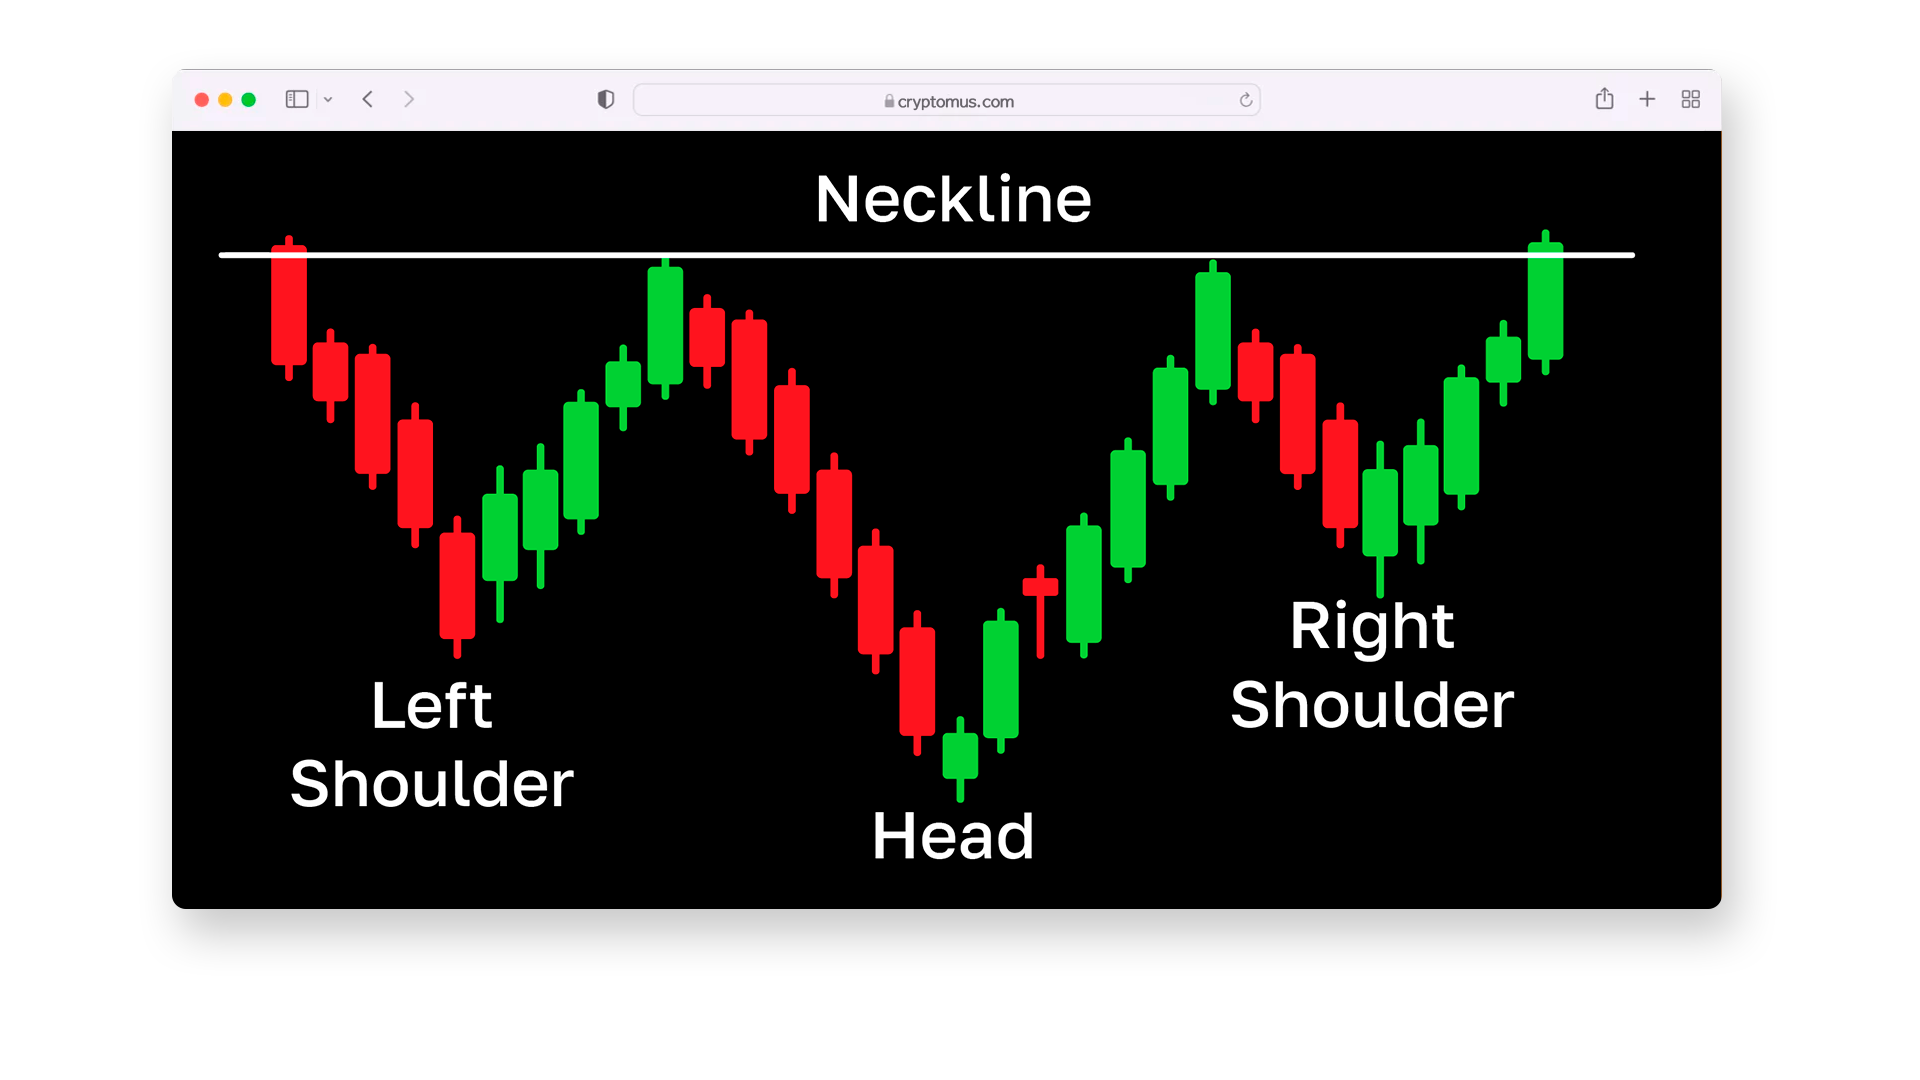
Визуально этот паттерн состоит из трех пиков разного размера. Самая высокая часть — это середина, которая является головой и указывает на бычье настроение. В этой части цена растет и достигает своего максимума. Пики по бокам служат плечами, чаще всего они примерно одинаковы по высоте. Чем больше паттерн, тем круче падение цены после разворота.
Важным элементом паттерна является линия шеи, которая представляет собой уровень поддержки. Она соединяет минимумы после левого плеча и головы. Прорыв линии шеи превращает поддержку в сопротивление, что сигнализирует о завершении паттерна и начале медвежьего тренда.
Как определить паттерн «Голова и плечи»?
Не всегда легко найти паттерн на динамическом графике, особенно если вы новичок в криптотрейдинге. Для таких случаев мы подготовили подробное руководство по определению паттерна «Голова и плечи»:
-
Найдите восходящий тренд: убедитесь, что цена находится в явном восходящем тренде. Это важно, потому что паттерн сигнализирует о возможном развороте тренда в сторону падения.
-
Ищите три пика: второй пик будет самым высоким, а боковые — немного ниже. Они должны быть четко видны, а откаты между ними — достаточно очевидны. Убедитесь, что дальнейший рост не происходит, и котировки пробивают уровень поддержки, направляясь вниз. Это сигнализирует о медвежьем развороте, о котором предупреждает паттерн.
-
Определите линию шеи: проведите линию через минимумы левого плеча и головы. Линия шеи может быть немного наклонной, но слишком сильное наклонение может указывать на низкую надежность паттерна.
-
Дождитесь пробоя: это ключевой фактор, подтверждающий паттерн. Пробой линии шеи обычно сопровождается резким увеличением объема торгов. Используйте дополнительные индикаторы, такие как RSI или MACD, чтобы подтвердить ослабление восходящего тренда и укрепление медвежьего настроя.
Этот процесс может показаться сложным на первых порах, но со временем вы приобретете больше опыта. Хорошая новость в том, что следуя этому алгоритму, вы сможете с уверенностью выявлять паттерн и использовать его в своей стратегии.
Инвертированный паттерн «Голова и плечи»
Важно отметить, что «Голова и плечи» — это фигура разворота, и у нее есть зеркальная версия. Инвертированный паттерн «Голова и плечи» — это бычий паттерн, который сигнализирует о возможном развороте нисходящего тренда в восходящий.
Структурно этот паттерн также состоит из трех основных частей, которые направлены вниз, и вместо пиков — есть впадины. Вторая часть является самой низкой точкой, которая служит головой. Это означает наименьшее значение актива. Плечи находятся по бокам, примерно на одинаковом уровне относительно друг друга. Впадины демонстрируют снижение потенциала медвежьей динамики.
Этот паттерн также имеет линию шеи, которая представляет собой уровень сопротивления, соединяющий минимумы откатов после левого плеча и головы. Пробой этой линии вверх указывает на завершение паттерна и начало восходящего тренда.
Как использовать паттерн «Голова и плечи» в торговле?
Теперь давайте более подробно рассмотрим практическое применение этой стратегии в криптотрейдинге. Следуйте этому алгоритму и обращайте внимание на детали, чтобы избежать ошибок, которые могут стоить вам прибыли:
- Определите паттерн на графике: ищите три ключевых элемента, где самый высокий пик — это голова паттерна. Убедитесь, что график формируется после восходящего тренда. Найдите линию шеи и ожидайте ее пробоя.
Если паттерн формируется после падения цены, это будет инвертированный «Голова и плечи». Он сигнализирует о возможном развороте нисходящего тренда в восходящий.
-
Дождитесь пробоя линии шеи: имейте в виду, что паттерн завершается после пробоя линии шеи вниз. Для зеркальной версии цена должна закрыться выше линии шеи.
-
Откройте сделку: откройте короткую позицию сразу после того, как свеча пробоя закроется ниже линии шеи.
-
Определите целевой уровень и установите стоп-лосс: измерьте расстояние от вершины головы до поддержки и отложите его от точки пробоя. Это будет ориентировочный целевой уровень. Установите стоп-лосс выше правого плеча, чтобы минимизировать риски. Поздравляем, вы близки к прибыли!
Чтобы проиллюстрировать, давайте рассмотрим конкретный пример. Предположим, вы видите паттерн «Голова и плечи» на графике актива. Сначала вы обнаруживаете левое плечо, когда актив поднимался до $40. Затем вы видите голову, когда цена достигала $45. Далее идет правое плечо, и цена опускается до $42, после чего снова поднимается до $43. Линия шеи находится на уровне $42, где произойдет пробой. Потенциальная прибыль составит $3.

Плюсы и минусы паттерна «Голова и плечи»
Каждое финансовое средство имеет свои преимущества и недостатки. Мы подготовили таблицу, чтобы вы могли наглядно увидеть характеристики паттерна «Голова и плечи»:
| Аспект | Характеристики | |
|---|---|---|
| Плюсы | Применимость на любых таймфреймах. Паттерн работает на любых временных интервалах, включая день и ночь. Универсальность графиков. Паттерн «Голова и плечи» можно использовать как на линейных, так и на свечных графиках. Точность определения точек входа и выхода. Паттерн предоставляет четкие уровни для входа (пробой линии шеи) и выхода (целевой уровень). Совместимость с другими инструментами. Трейдеры используют его в сочетании с другими индикаторами (RSI, MACD) и уровнями поддержки/сопротивления для повышения точности сигналов. | |
| Минусы | Медленное формирование. Паттерн может занять время для формирования, особенно на более высоких таймфреймах, что требует терпения. Сложность на ранних стадиях. Сложно распознать паттерн на ранних стадиях, так как для этого нужно увидеть половину завершенного графика. Неясность. Паттерн может выглядеть нечетким на графиках из-за нерегулярных движений цены, что затрудняет его определение. Сложность для новичков. Неопытные трейдеры могут пропустить паттерн или неправильно интерпретировать его. |

Можно сделать вывод, что «Голова и плечи» — это надежный и универсальный паттерн. Он показывает настроение рынка, дает четкое представление о пробое и помогает в открытии позиций. Вы всегда можете проверить эффективность этой стратегии на бирже Cryptomus. Широкий выбор торговых пар дает возможность применять этот паттерн множество раз и убедиться в его эффективности.
Вы когда-нибудь использовали паттерн «Голова и плечи»? Напишите о своем опыте в комментариях!


Упростите свое крипто-путешествие
Хотите хранить, отправлять, принимать, делать ставки или торговать криптовалютами? С Cryptomus все возможно — зарегистрируйтесь и управляйте своими криптовалютными средствами с помощью наших удобных инструментов.
Начать